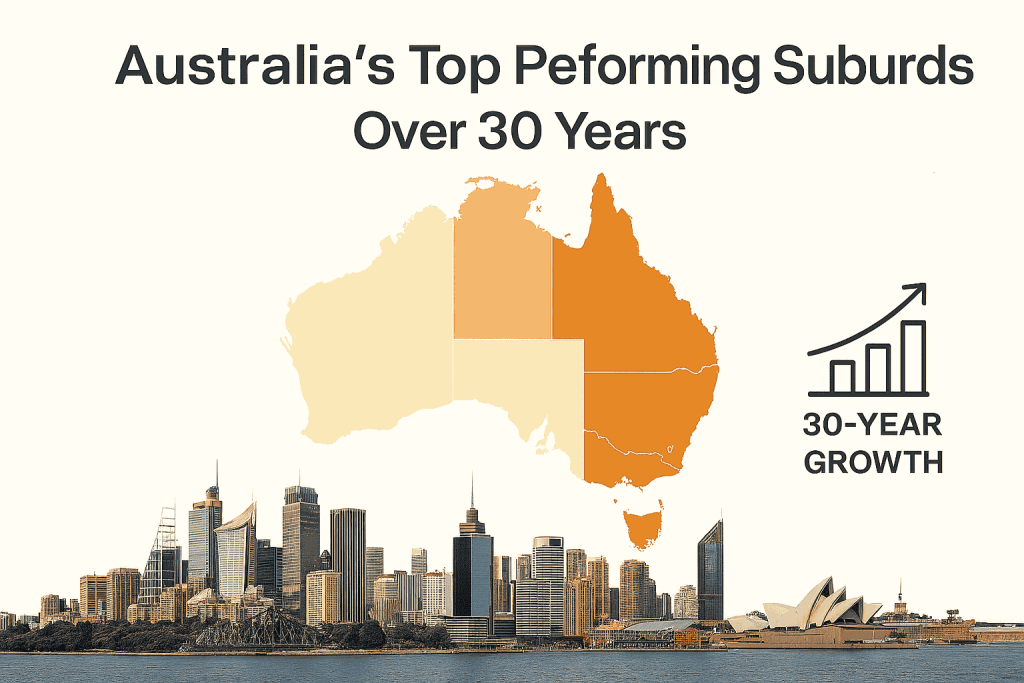
Australia’s Top Performing Suburbs 1995-2025– National and State Breakdown
Australia’s property market has grown strongly over the past three decades. However, some suburbs have risen far faster than others. According to PropTrack data, these suburbs stand out both nationally and across each state. In this article, we explore the suburbs that have grown the most, what drives their performance, and how their current median property values compare.
Why This Matters for Homebuyers and Investors
Looking at long-term growth trends can help buyers and investors make smarter decisions. Although past growth does not promise future results, suburbs with steady rises usually benefit from reliable demand, strong infrastructure, and lifestyle appeal. Because of this, these areas often remain attractive choices for the long term.
Australia’s Top 10 Suburbs Nationwide
Eight of the top 10 suburbs are located in Southeast Queensland, showing its long-term strength (Rea Group, PropTrack)
| Rank | Suburb | Region | 30-Year Price Growth Factor | Current Median Price |
|---|---|---|---|---|
| 1 | New Beith | Logan – Beaudesert | 18.1× | $1,268,000 |
| 2 | Flagstone | Logan – Beaudesert | 17.2× | $880,000 |
| 3 | Russell Island | Brisbane – East | 17.1× | $436,000 |
| 4 | Regency Downs | Ipswich | 17.1× | $802,000 |
| 5 | Amaroo | ACT | 16.8× | $901,000 |
| 6 | Plainland | Ipswich | 16.3× | $764,000 |
| 7 | Warner | Moreton Bay – South | 16.0× | $1,060,000 |
| 8 | Nicholls | ACT | 15.6× | $1,021,000 |
| 9 | Macleay Island | Brisbane – East | 15.6× | $537,000 |
| 10 | Mount Cotton | Brisbane – East | 15.4× | $1,109,000 |
Top Performing Suburbs by State
Below is a clearer breakdown of the highest-growth suburbs across all major states and territories.
Queensland (Brisbane Region)
It continues to lead the nation, especially in and around Southeast Queensland.
| Suburb | SA4 Region | 30-Year Price Growth Factor | Current Dwelling AVM |
|---|---|---|---|
| New Beith | Logan – Beaudesert | 18.1 | $1,268,000 |
| Flagstone | Logan – Beaudesert | 17.2 | $880,000 |
| Russell Island | Brisbane – East | 17.1 | $436,000 |
| Regency Downs | Ipswich | 17.1 | $802,000 |
| Plainland | Ipswich | 16.3 | $764,000 |
| Warner | Moreton Bay – South | 16.0 | $1,060,000 |
| Macleay Island | Brisbane – East | 15.6 | $537,000 |
| Mount Cotton | Brisbane – East | 15.4 | $1,109,000 |
| Eatons Hill | Moreton Bay – South | 15.4 | $1,254,000 |
| Springfield | Ipswich | 15.3 | $884,000 |
Insight: Southeast Queensland delivers strong growth and remains relatively affordable, making it ideal for both investors and first-home buyers.
New South Wales (Sydney Region)
Sydney shows a mix of high-end coastal suburbs and fast-growing outer areas.
| Suburb | SA4 Region | 30-Year Price Growth Factor | Current Dwelling AVM |
|---|---|---|---|
| Glenwood | Sydney – Blacktown | 15.0 | $1,694,000 |
| Cecil Hills | Sydney – South West | 14.7 | $1,270,000 |
| Mount Annan | Sydney – Outer South West | 14.1 | $1,163,000 |
| Bronte | Sydney – Eastern Suburbs | 13.4 | $2,645,000 |
| Wattle Grove | Sydney – South West | 12.8 | $1,335,000 |
| Narellan Vale | Sydney – Outer South West | 12.5 | $1,121,000 |
| Clovelly | Sydney – Eastern Suburbs | 12.1 | $3,540,000 |
| Prestons | Sydney – South West | 11.9 | $1,221,000 |
| Bellevue Hill | Sydney – Eastern Suburbs | 11.3 | $3,117,000 |
| Green Valley | Sydney – South West | 11.3 | $1,136,000 |
Insight: Sydney’s growth is steady, but many top suburbs come with high entry prices.
Victoria (Melbourne Region)
The Mornington Peninsula stands out with strong lifestyle-driven growth.
| Suburb | SA4 Region | 30-Year Price Growth Factor | Current Dwelling AVM |
|---|---|---|---|
| Blairgowrie | Mornington Peninsula | 13.2 | $1,279,000 |
| Portsea | Mornington Peninsula | 13.1 | $1,928,000 |
| Sorrento | Mornington Peninsula | 13.0 | $1,632,000 |
| Ashburton | Melbourne – Inner East | 12.4 | $2,110,000 |
| Rye | Mornington Peninsula | 11.6 | $943,000 |
| Deepdene | Melbourne – Inner East | 11.6 | $2,915,000 |
| Seddon | Melbourne – West | 11.5 | $1,085,000 |
| Aspendale | Melbourne – Inner South | 11.3 | $1,373,000 |
| Somers | Mornington Peninsula | 11.2 | $1,232,000 |
| Kingsville | Melbourne – West | 11.2 | $1,035,000 |
Insight: Lifestyle, coastal access, and strong demand continue to lift values along the Mornington Peninsula.
Perth (Western Australia)
Its top-performing suburbs combine affordability with coastal and inner-city lifestyle benefits.
| Suburb | SA4 Region | 30-Year Price Growth Factor | Current Dwelling AVM |
|---|---|---|---|
| Leda | Perth – South West | 12.0 | $690,000 |
| Bullsbrook | Perth – North East | 11.7 | $892,000 |
| Brookdale | Perth – South East | 11.6 | $630,000 |
| City Beach | Perth – Inner | 11.2 | $2,977,000 |
| Mount Hawthorn | Perth – Inner | 10.5 | $1,659,000 |
| Ascot | Perth – South East | 10.5 | $1,015,000 |
| Trigg | Perth – North West | 10.4 | $2,368,000 |
| Karrinyup | Perth – North West | 10.2 | $1,557,000 |
| Gwelup | Perth – North West | 10.2 | $1,631,000 |
| Girrawheen | Perth – North West | 10.2 | $707,000 |
Insight: Perth offers suburban value alongside premium coastal options, appealing to a wide range of buyers.
Adelaide (South Australia)
Its best-performing suburbs show a strong mix of affordability and reliable growth.
| Suburb | SA4 Region | 30-Year Price Growth Factor | Current Dwelling AVM |
|---|---|---|---|
| Elizabeth South | Adelaide – North | 11.7 | $583,000 |
| Davoren Park | Adelaide – North | 11.4 | $532,000 |
| Smithfield Plains | Adelaide – North | 11.3 | $558,000 |
| Henley Beach South | Adelaide – West | 11.2 | $1,526,000 |
| Elizabeth Vale | Adelaide – North | 11.1 | $652,000 |
| Elizabeth Grove | Adelaide – North | 11.1 | $593,000 |
| Henley Beach | Adelaide – West | 10.8 | $1,507,000 |
| Greenacres | Adelaide – North | 10.8 | $892,000 |
| O’Sullivan Beach | Adelaide – South | 10.7 | $748,000 |
| Christies Beach | Adelaide – South | 10.7 | $797,000 |
Insight: Northern Adelaide continues to deliver strong growth while staying affordable for many buyers.
Hobart (Tasmania)
This remains the most affordable capital city in Australia, although its long-term growth is more modest.
| Suburb | SA4 Region | 30-Year Price Growth Factor | Current Dwelling AVM |
|---|---|---|---|
| Bridgewater | Hobart | 11.7 | $421,000 |
| Dodges Ferry | Hobart | 10.8 | $567,000 |
| Richmond | Hobart | 8.6 | $760,000 |
| West Hobart | Hobart | 8.3 | $948,000 |
| Sorell | Hobart | 7.9 | $617,000 |
| Kingston Beach | Hobart | 7.9 | $989,000 |
| Blackmans Bay | Hobart | 7.9 | $960,000 |
| Warrane | Hobart | 7.8 | $616,000 |
| Risdon Vale | Hobart | 7.8 | $588,000 |
| North Hobart | Hobart | 7.7 | $1,034,000 |
Insight: Hobart is still highly affordable, making it attractive for buyers seeking value but slower growth.
Key Takeaways from Australia’s Top Performing Suburbs
- Southeast Queensland leads the nation with exceptional growth and strong affordability.
- Sydney and Melbourne offer premium suburbs with steady, long-term performance.
- Perth and Adelaide provide a balance of lifestyle appeal and affordability.
- Hobart remains the cheapest capital city, ideal for buyers wanting lower entry prices.
Want to see more important Statistics? Click here