


Key statistics
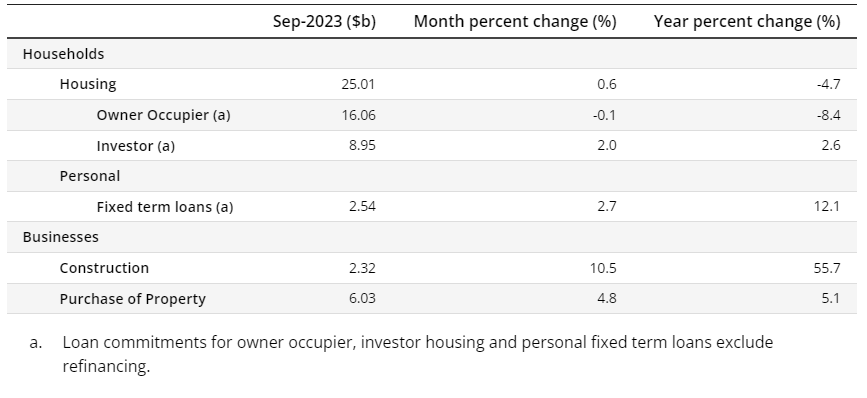
In September 2023, there were fluctuations in new home loan indicators/ commitments (adjusted for seasonal variations):
- Housing loan commitments increased by 0.6%.
- Personal fixed-term loans witnessed a rise of 2.7%.
- Business construction loans, a series known for its volatility, surged by 10.5% (seasonally adjusted) but experienced a slight decline of 0.2% in trend terms.
- Business purchase of property loans, another series prone to volatility, showed a growth of 4.8% (seasonally adjusted) and a 0.9% increase in trend terms.
Value of new borrower-accepted loan commitments (seasonally adjusted)
Housing finance for first home buyers:
The release of data on the quantity and value of new loan commitments for first home buyers has been reinstated this month, ending a temporary suppression that occurred in July and August 2023. Collaborative efforts between ABS, APRA, and data providers have successfully addressed data quality issues. It is important to highlight that the first home buyer series has undergone upward revisions, reaching back to January 2022.
Housing finance
In September 2023, when adjusted for seasonal variations, the value of new loan commitments displayed the following changes:
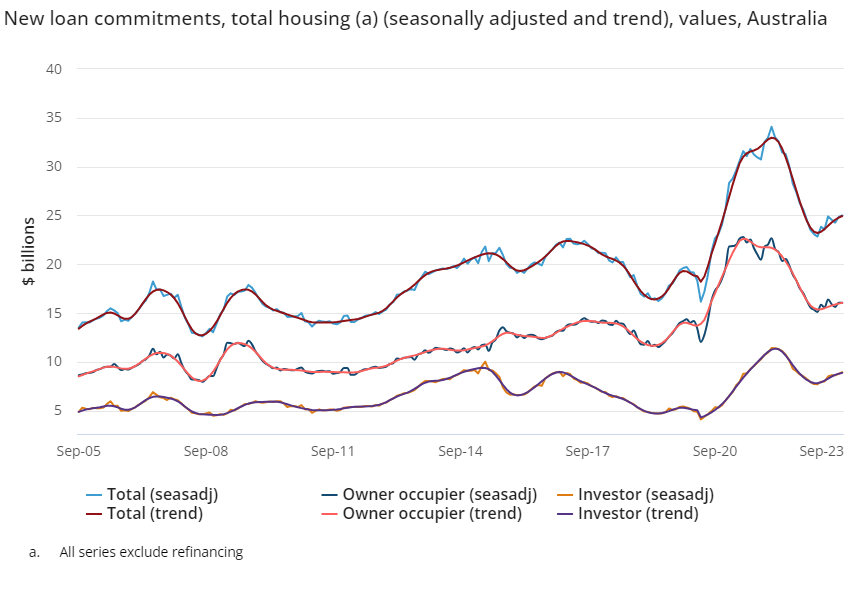
- Total housing witnessed a 0.6% increase to $25.0 billion, following a 2.4% rise in August. However, it was 4.7% lower compared to the same period a year ago.
- Owner-occupier housing experienced a slight decline of 0.1% to $16.1 billion and was 8.4% lower compared to the previous year.
- Investor housing saw a 2.0% rise to $9.0 billion and showed a 2.6% increase compared to the corresponding period in the previous year.
In September 2023, when adjusted for seasonal variations, the value of external refinancing exhibited the following variations:
- Total housing experienced a 7.8% decrease, amounting to $18.5 billion. It was 1.5% higher compared to the corresponding period a year ago.
- Owner-occupier housing saw an 8.4% decline to $12.5 billion but showed a modest 0.3% increase compared to the previous year.
- Investor housing recorded a 6.4% decrease, reaching $6.0 billion, while marking a 4.1% rise compared to the same period in the previous year.

Personal finance
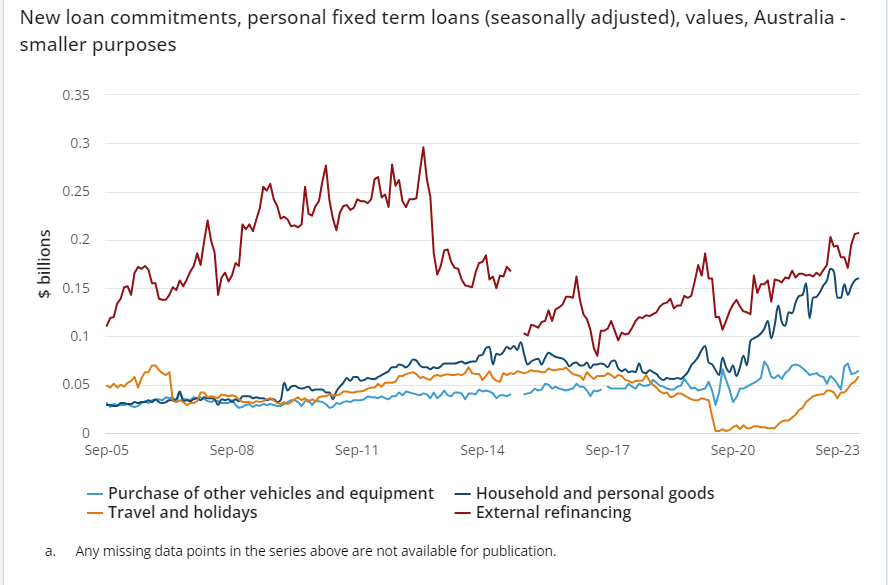
In September 2023, when adjusted for seasonal variations, the value of new loan commitments demonstrated the following trends:
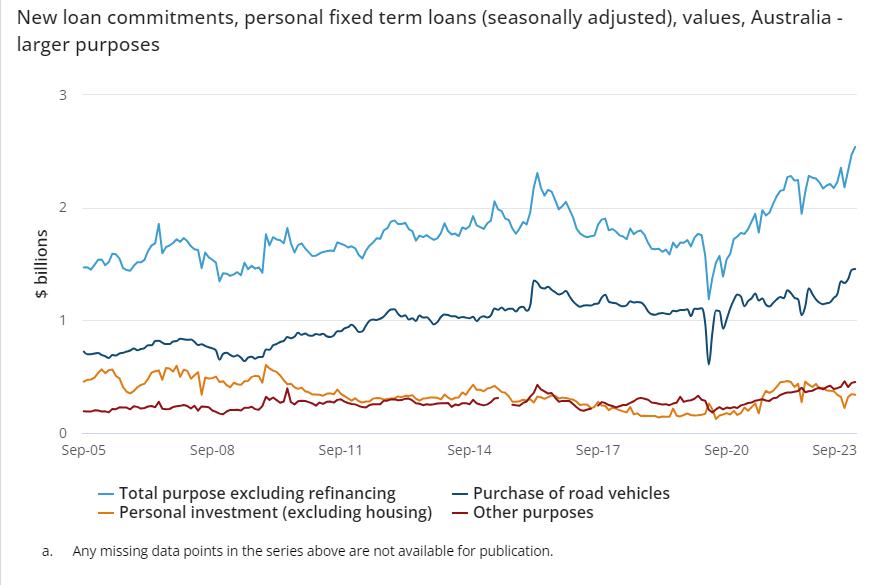
- Fixed term personal finance experienced a 2.7% increase, following a rise of 6.2% in August.
- Loan commitments for road vehicles showed a 0.6% rise.
- Personal investment commitments, however, witnessed a decline of 1.6%.
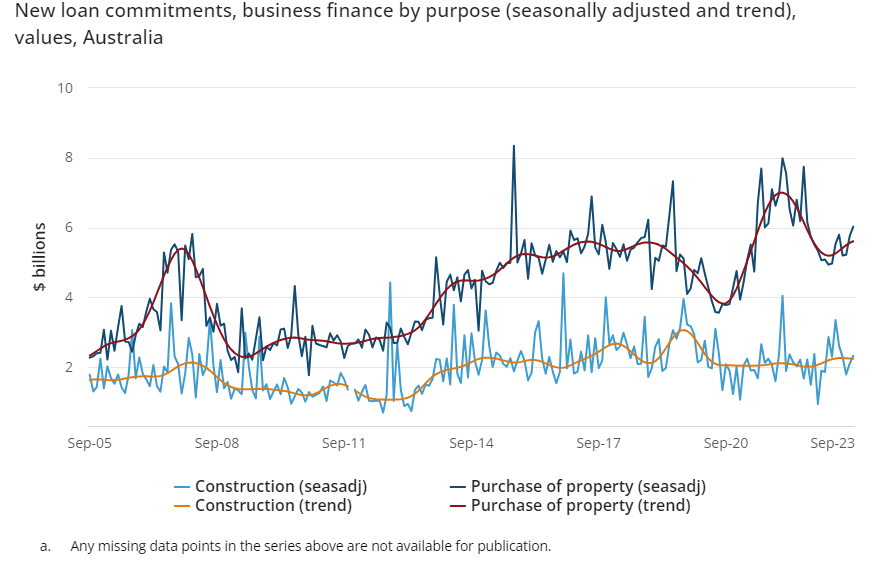
Business finance
In September 2023, when adjusted for seasonal variations, the value of new loan commitments demonstrated the following patterns:
- Construction finance witnessed a substantial 10.5% increase, following a notable rise of 17.3% in August. However, in trend terms, it experienced a slight decline of 0.2%.
- The purchase of property loans showed a 4.8% increase, following a rise of 10.2% in August. In trend terms, it registered a 0.9% growth. It’s important to note that these series may exhibit volatile month-to-month fluctuations due to their susceptibility to the influence of a small number of high-value loans.
Housing finance (detailed)
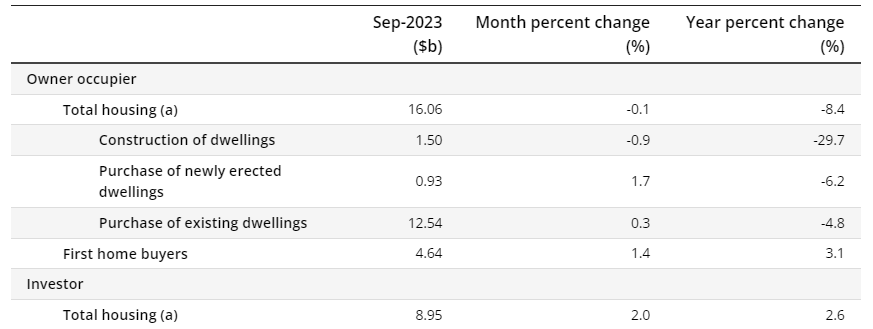
Value of new loan commitments by purpose (seasonally adjusted)
Number of new loan commitments by purpose (seasonally adjusted)
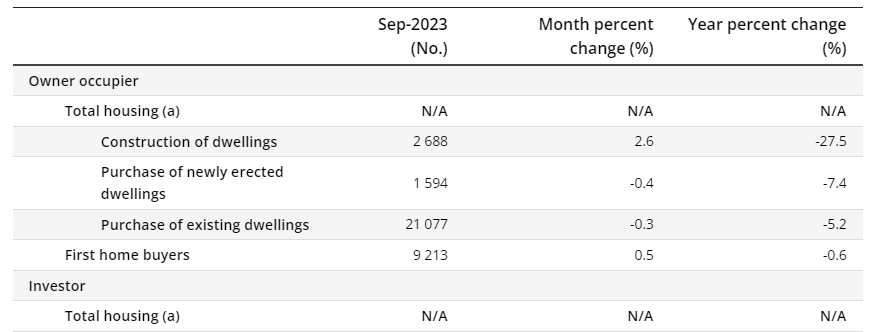
The housing category encompasses loan commitments for dwellings, the purchase of residential land, and for alterations and additions.
It’s worth noting that there is no available seasonally adjusted or trend data for the number of owner-occupiers or investors in total housing, as the data was collected starting from July 2019.
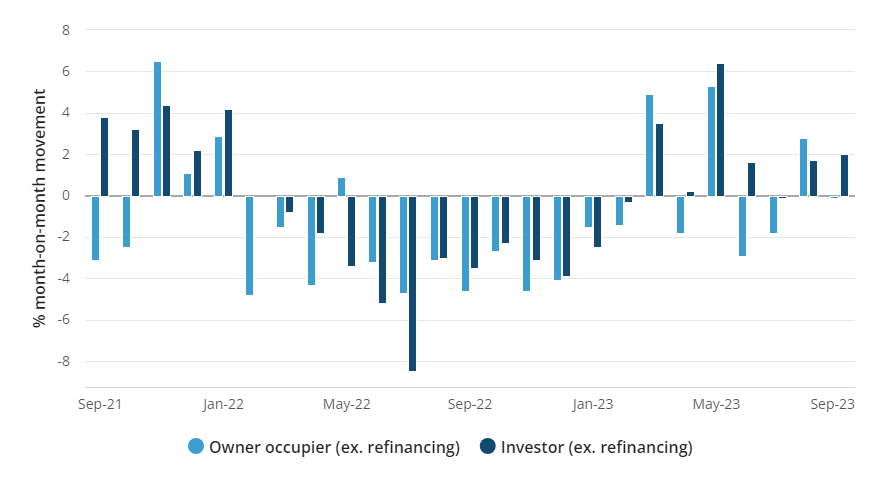
In September 2023, when adjusted for seasonal variations, the value of new loan commitments showed the following changes:
- Owner-occupiers experienced a slight decline of 0.1%, following a rise of 2.8% in August.
- Investors, on the other hand, saw a 2.0% increase, following a rise of 1.7% in August.
New loan commitments for housing by purpose (seasonally adjusted), monthly growth in value, Australia
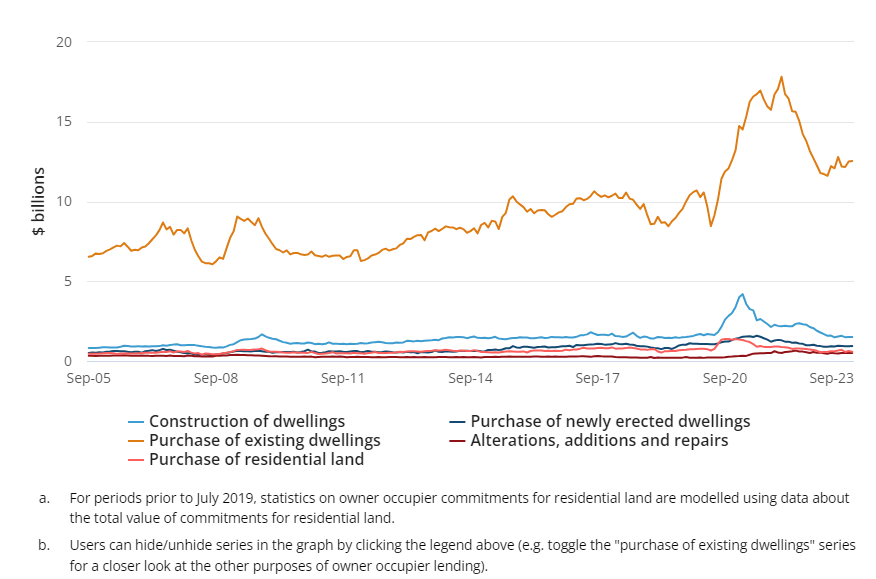
In September 2023, when adjusted for seasonal variations, the value of new loan commitments for owner-occupier housing exhibited the following trends:
- For the purchase of existing dwellings, there was a 0.3% increase, although it remained 4.8% lower compared to the corresponding period a year ago.
- In terms of the construction of new dwellings, there was a 0.9% decrease, marking a substantial 29.7% decline compared to a year ago.
- For the purchase of new dwellings, there was a 1.7% rise, yet it was 6.2% lower compared to the same period in the previous year.
New loan commitments for owner occupier housing by purpose (seasonally adjusted), values, Australia
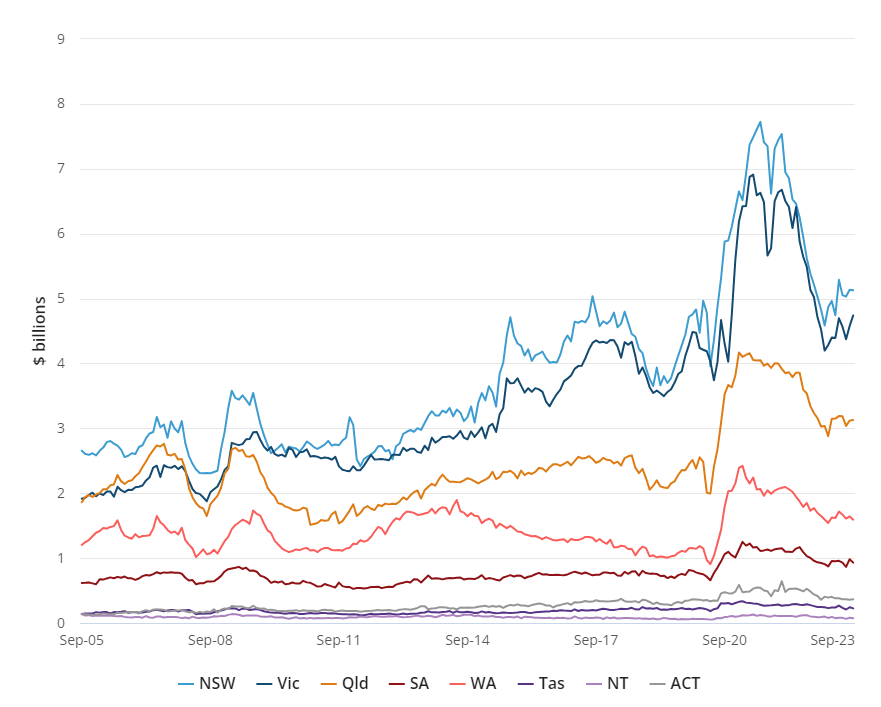
In September 2023, when adjusted for seasonal variations, the value of new loan commitments for owner-occupier housing displayed the following regional variations:
South Australia observed a decline of 5.4%. Western Australia with a 3.0% decrease. Tasmania with a 7.2% decrease. New South Wales with a 0.2% decrease. And the Northern Territory with a 9.0% decrease.
Conversely, we noted increases in Victoria, where there was a 3.6% rise. Queensland with a 0.4% rise. And the Australian Capital Territory with a 2.7% rise.
It’s important to note that the Tasmania, the Northern Territory, and Australian Capital Territory series are smaller and typically more volatile.
New loan commitments for owner occupier housing (seasonally adjusted), values, by state
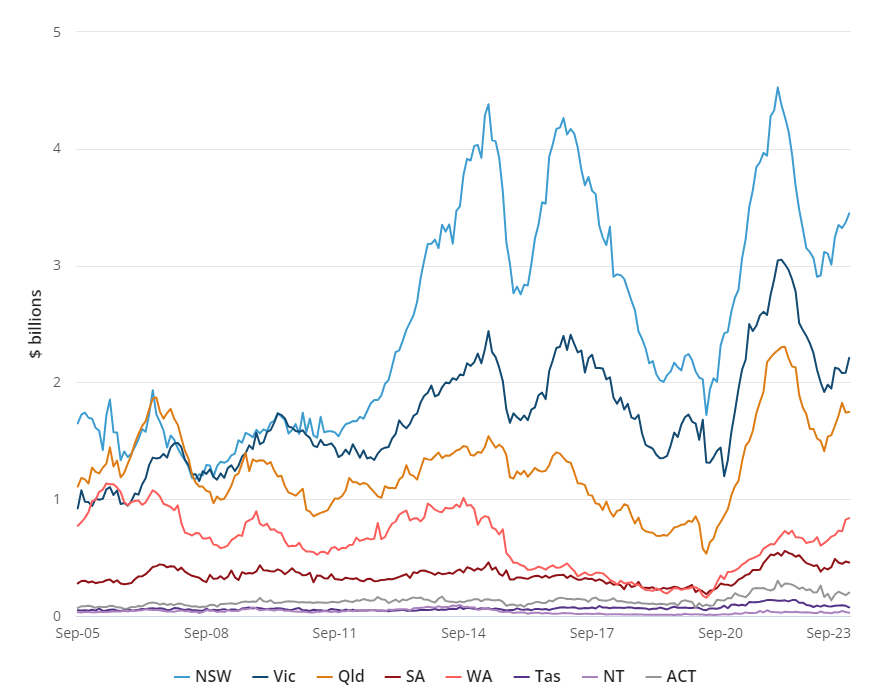
In September 2023, when adjusted for seasonal variations, the value of new loan commitments for investor housing exhibited varying trends across regions:
There were increases observed in Victoria, where there was a 6.1% rise, New South Wales with a 2.3% rise, the Australian Capital Territory with a 12.3% rise, Western Australia with a 1.6% rise, and Queensland with a 0.3% rise.
Conversely, decreases were noted in Tasmania, where there was a 14.7% decline, South Australia with a 1.7% decline, and the Northern Territory with a 19.9% decline. It’s important to highlight that the Tasmania, the Northern Territory, and Australian Capital Territory series are smaller and typically more volatile.
New loan commitments for investor housing (seasonally adjusted). values, by state
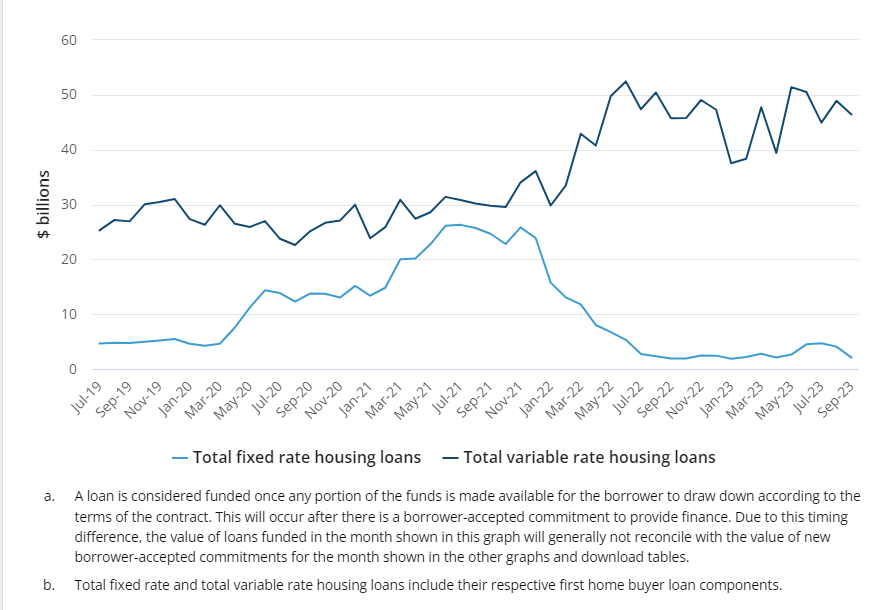
In September 2023, in unadjusted terms:
- The total value of new variable rate loan commitments funded in the month experienced a 5.1% decrease.
- The total value of new fixed rate loan commitments funded in the month witnessed a substantial 49.0% decline.
Fixed vs variable rate loans funded (a) in the month, including refinancing (original), value, Australia.
In September 2023, in unadjusted terms, the average loan sizes for owner-occupier dwellings, encompassing construction, the purchase of new dwellings, and existing dwellings:
- Increased by 2.4% nationally, rising from $585,000 to $599,000.
- However, it remained 3.0% lower compared to the peak recorded in January 2022.
Average loan sizes for owner-occupier dwellings (original), by state.

First home buyers
In September 2023, when adjusted for seasonal variations, the number of new loan commitments for owner-occupier first home buyers demonstrated the following patterns:
- Nationally, there was a 0.5% increase to 9,213, following a 4.6% rise in August. However, it registered a 0.6% decrease compared to the corresponding period a year ago.
- Increases were observed in Victoria with a 6.3% rise, Queensland with a 3.0% rise, the Australian Capital Territory with an 8.9% rise, South Australia with a 3.0% rise, and Western Australia with a 1.1% rise.
- Conversely, decreases were noted in New South Wales with a 7.0% decline, the Northern Territory with a 9.4% decline, and Tasmania with a 2.9% decline.
Looking for the best deal on your first home? Visit RateBuster.com.au today and compare a wide range of first home buyer home loans. Find the perfect match for your needs and start your homeownership journey on the right foot!
READ MORE:
