Key statistics
As of May 2023, there were notable shifts in new loan commitments (seasonally adjusted):
1. Housing loan commitments experienced a 4.8% increase.
2. Personal fixed term loans saw a rise of 4.3%.
3. Business construction loans, which tend to be somewhat volatile, decreased by 19.4%. However, when considering the trend, there was a modest 1.6% increase.
4. Business purchases of property, also known for their volatility, surged by 8.1%. Additionally, in trend terms, there was a 1.6% rise.
Housing Finance
In May 2023, when considering seasonally adjusted terms, the value of new loan commitments exhibited distinct trends:
1. Total housing loan commitments increased by 4.8% to reach $24.9 billion. This followed a 1.0% decline in April and marked a 20.5% decrease from the previous year.
2. Owner-occupier housing loans experienced a 4.0% growth, reaching $16.4 billion. However, these figures were 20.2% lower compared to the same period last year.
3. Investor housing loans demonstrated a notable surge of 6.2%, amounting to $8.5 billion. Despite this increase, there was still a significant 20.9% drop in comparison to the previous year.
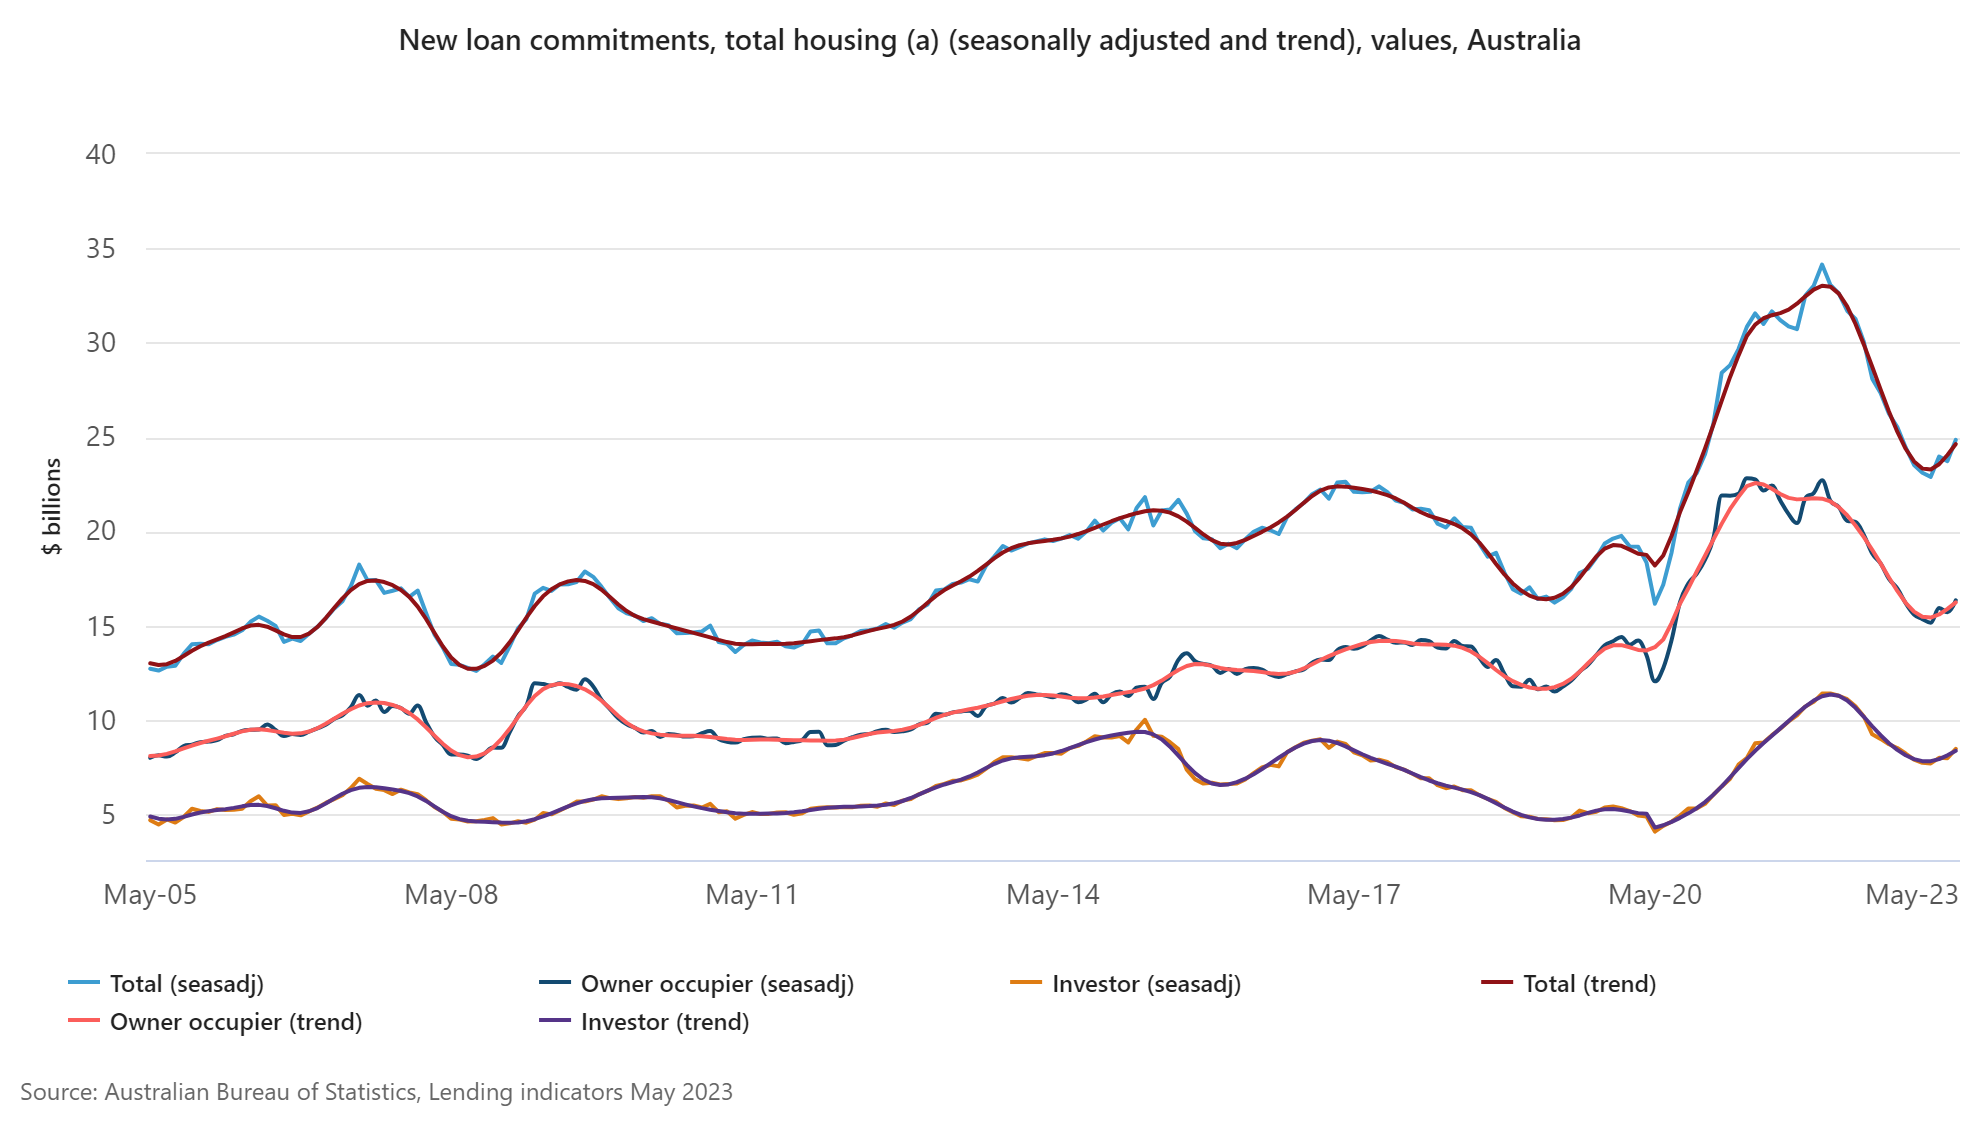
- All series exclude refinancing
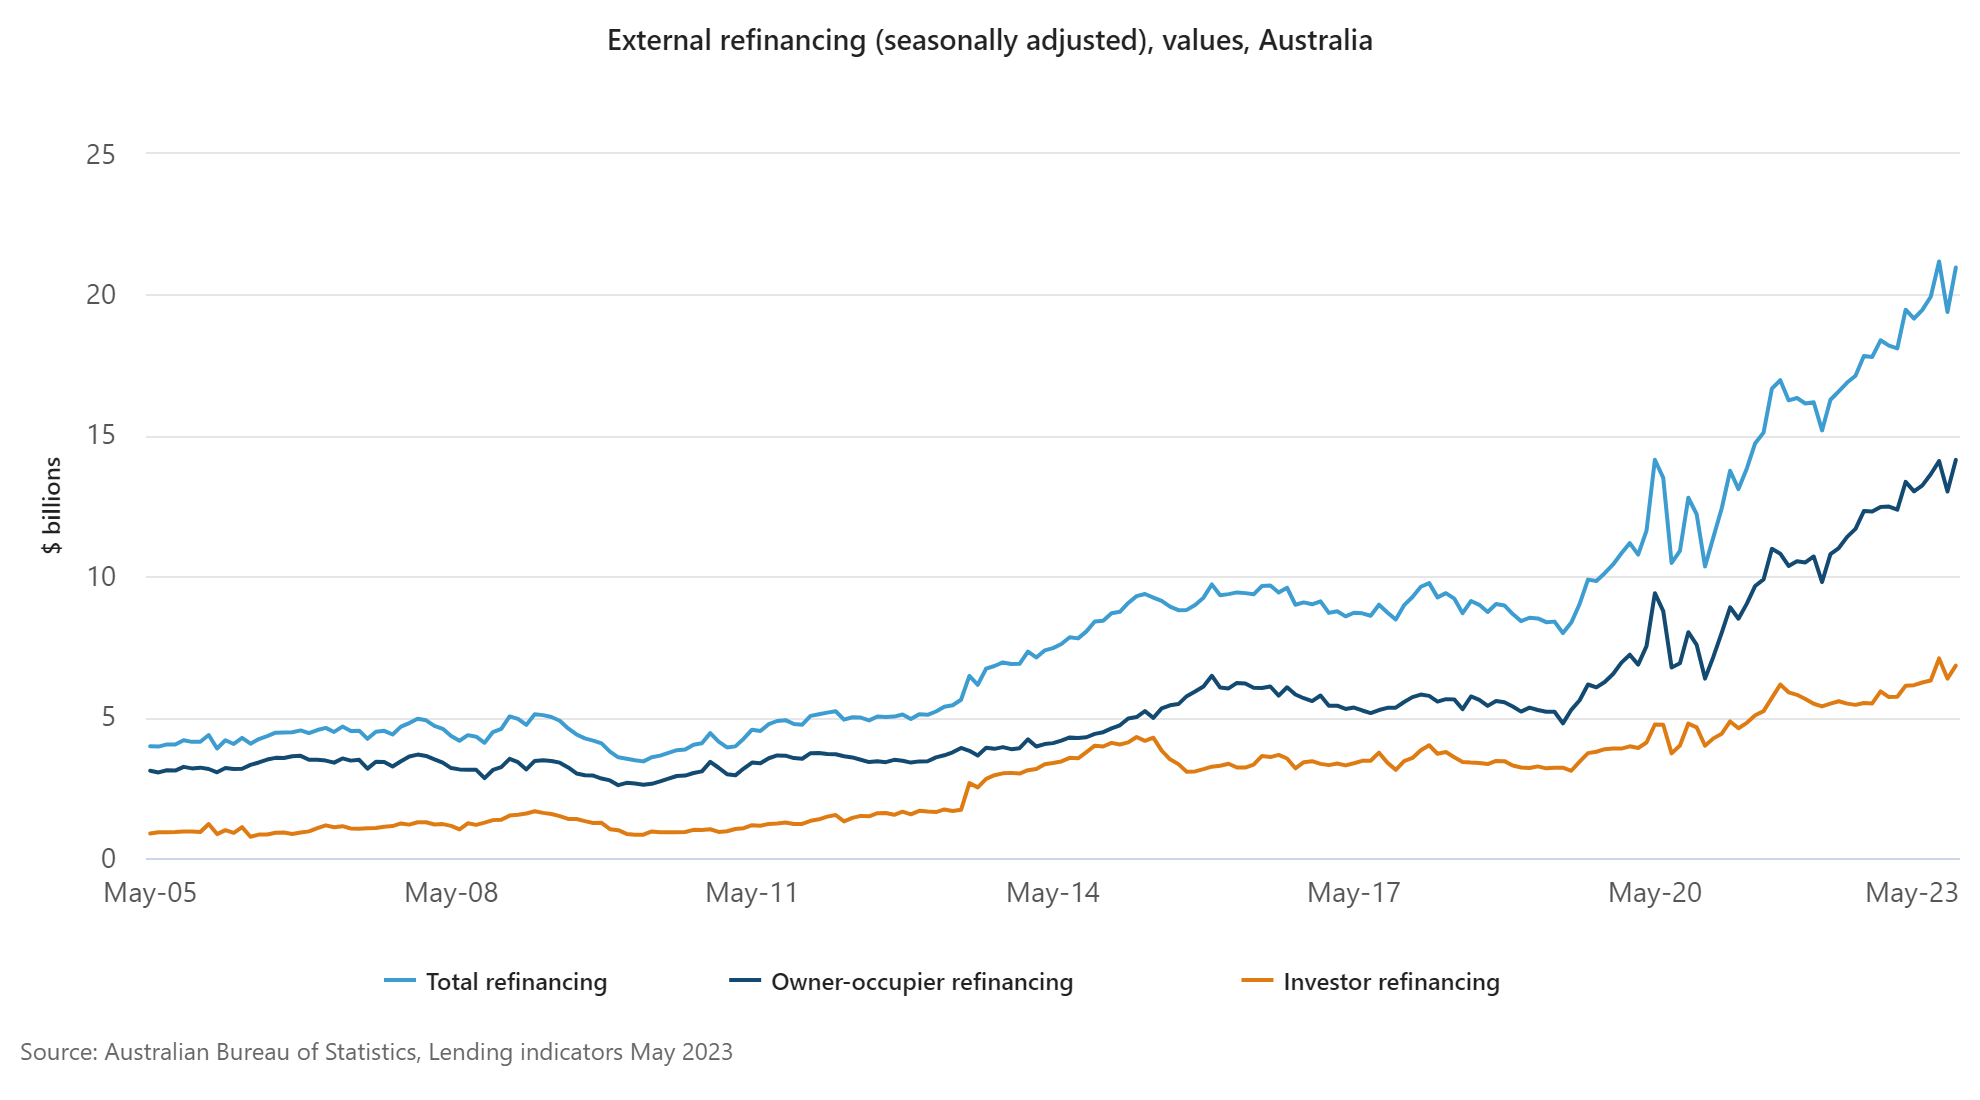
In May 2023, when examining seasonally adjusted figures, the value of external refinancing showed notable changes:
1. Total housing external refinancing increased by 8.1%, reaching $21.0 billion, which marked a significant 22.4% surge compared to the previous year.
2. Owner-occupier housing external refinancing experienced a remarkable 8.6% rise, setting a new high at $14.1 billion. This represented a substantial 21.0% increase compared to the same period last year.
3. Investor housing external refinancing demonstrated a solid 7.2% growth, amounting to $6.8 billion. Notably, this was 25.6% higher compared to the previous year.
Housing finance (detailed)
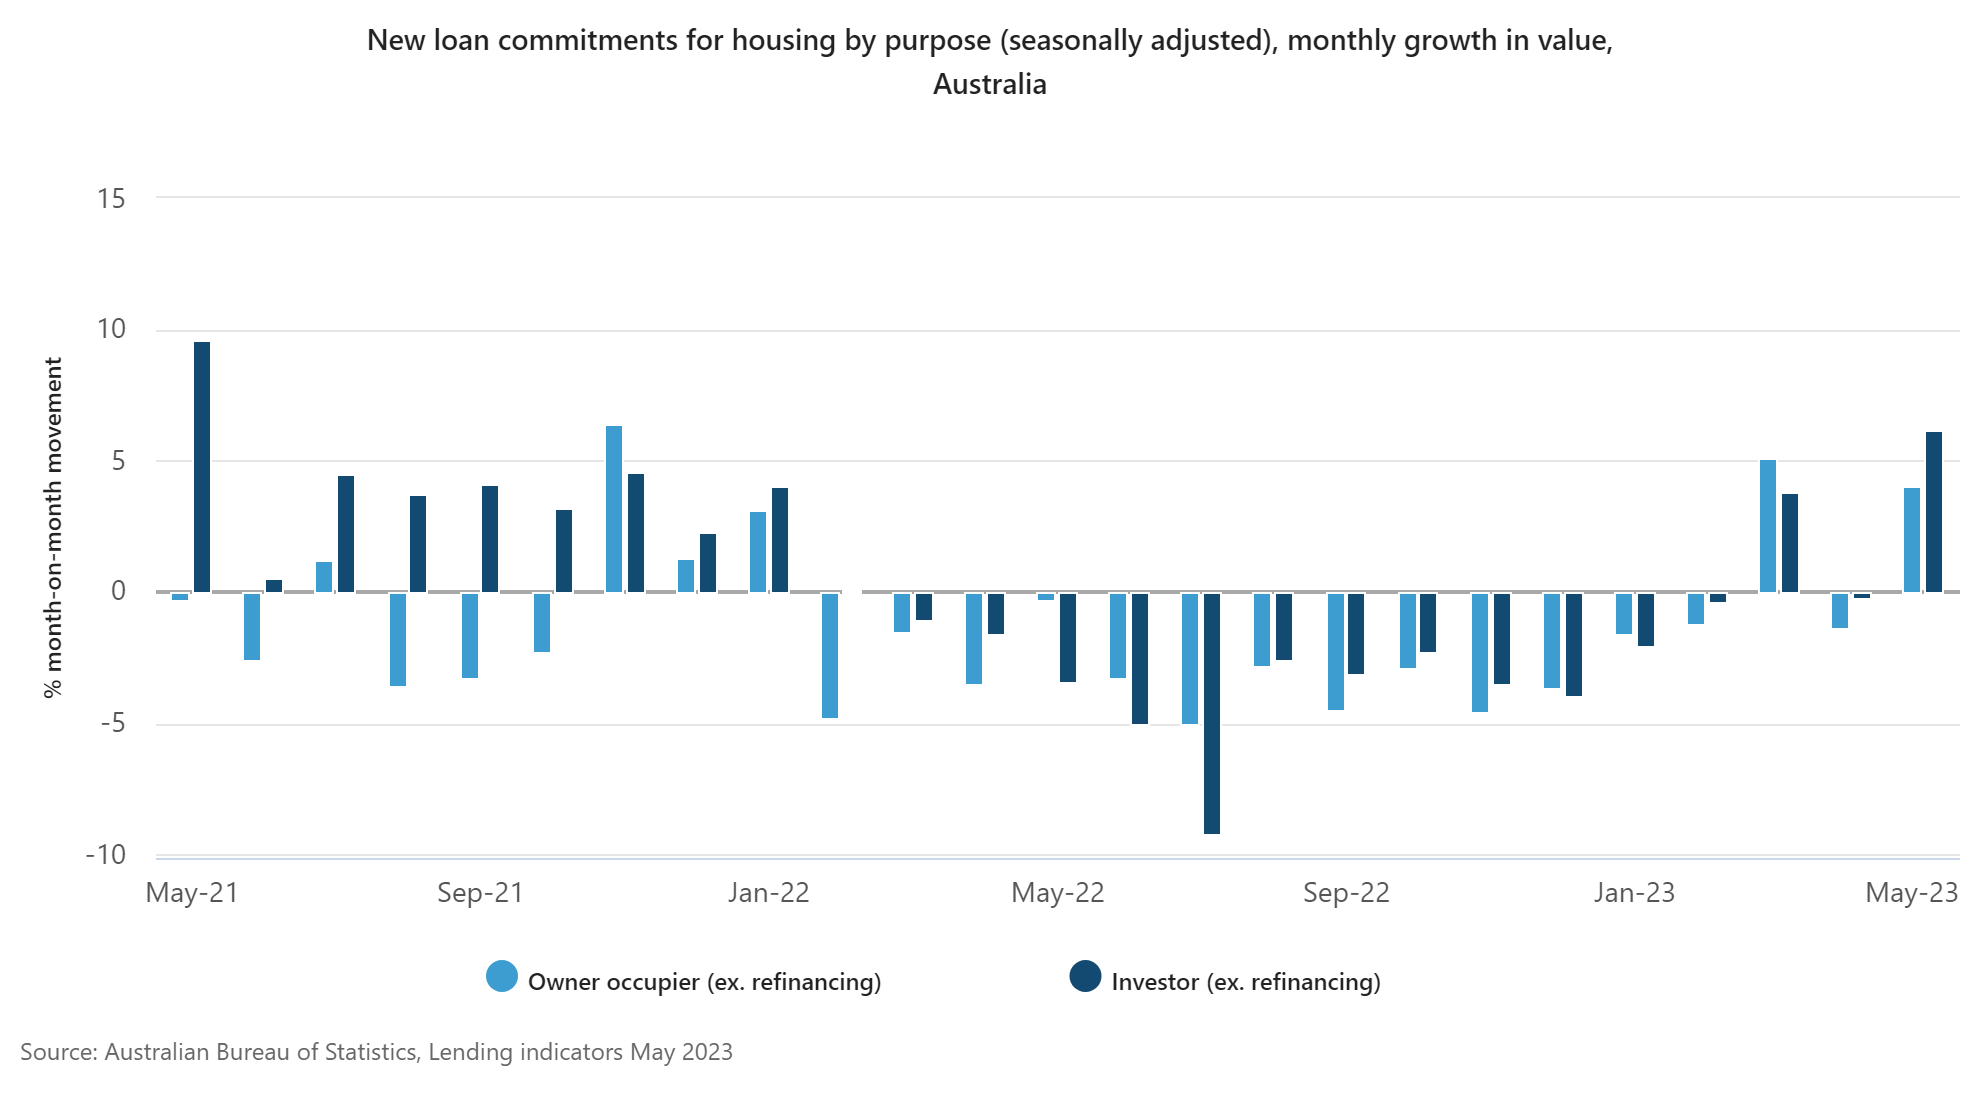
In May 2023, considering seasonally adjusted data, there were distinct changes in the value of new loan commitments:
1. Owner-occupier loan commitments saw a 4.0% increase, rebounding from a 1.4% decrease in April.
2. Investor loan commitments experienced a notable 6.2% rise, recovering from a 0.2% dip in April.
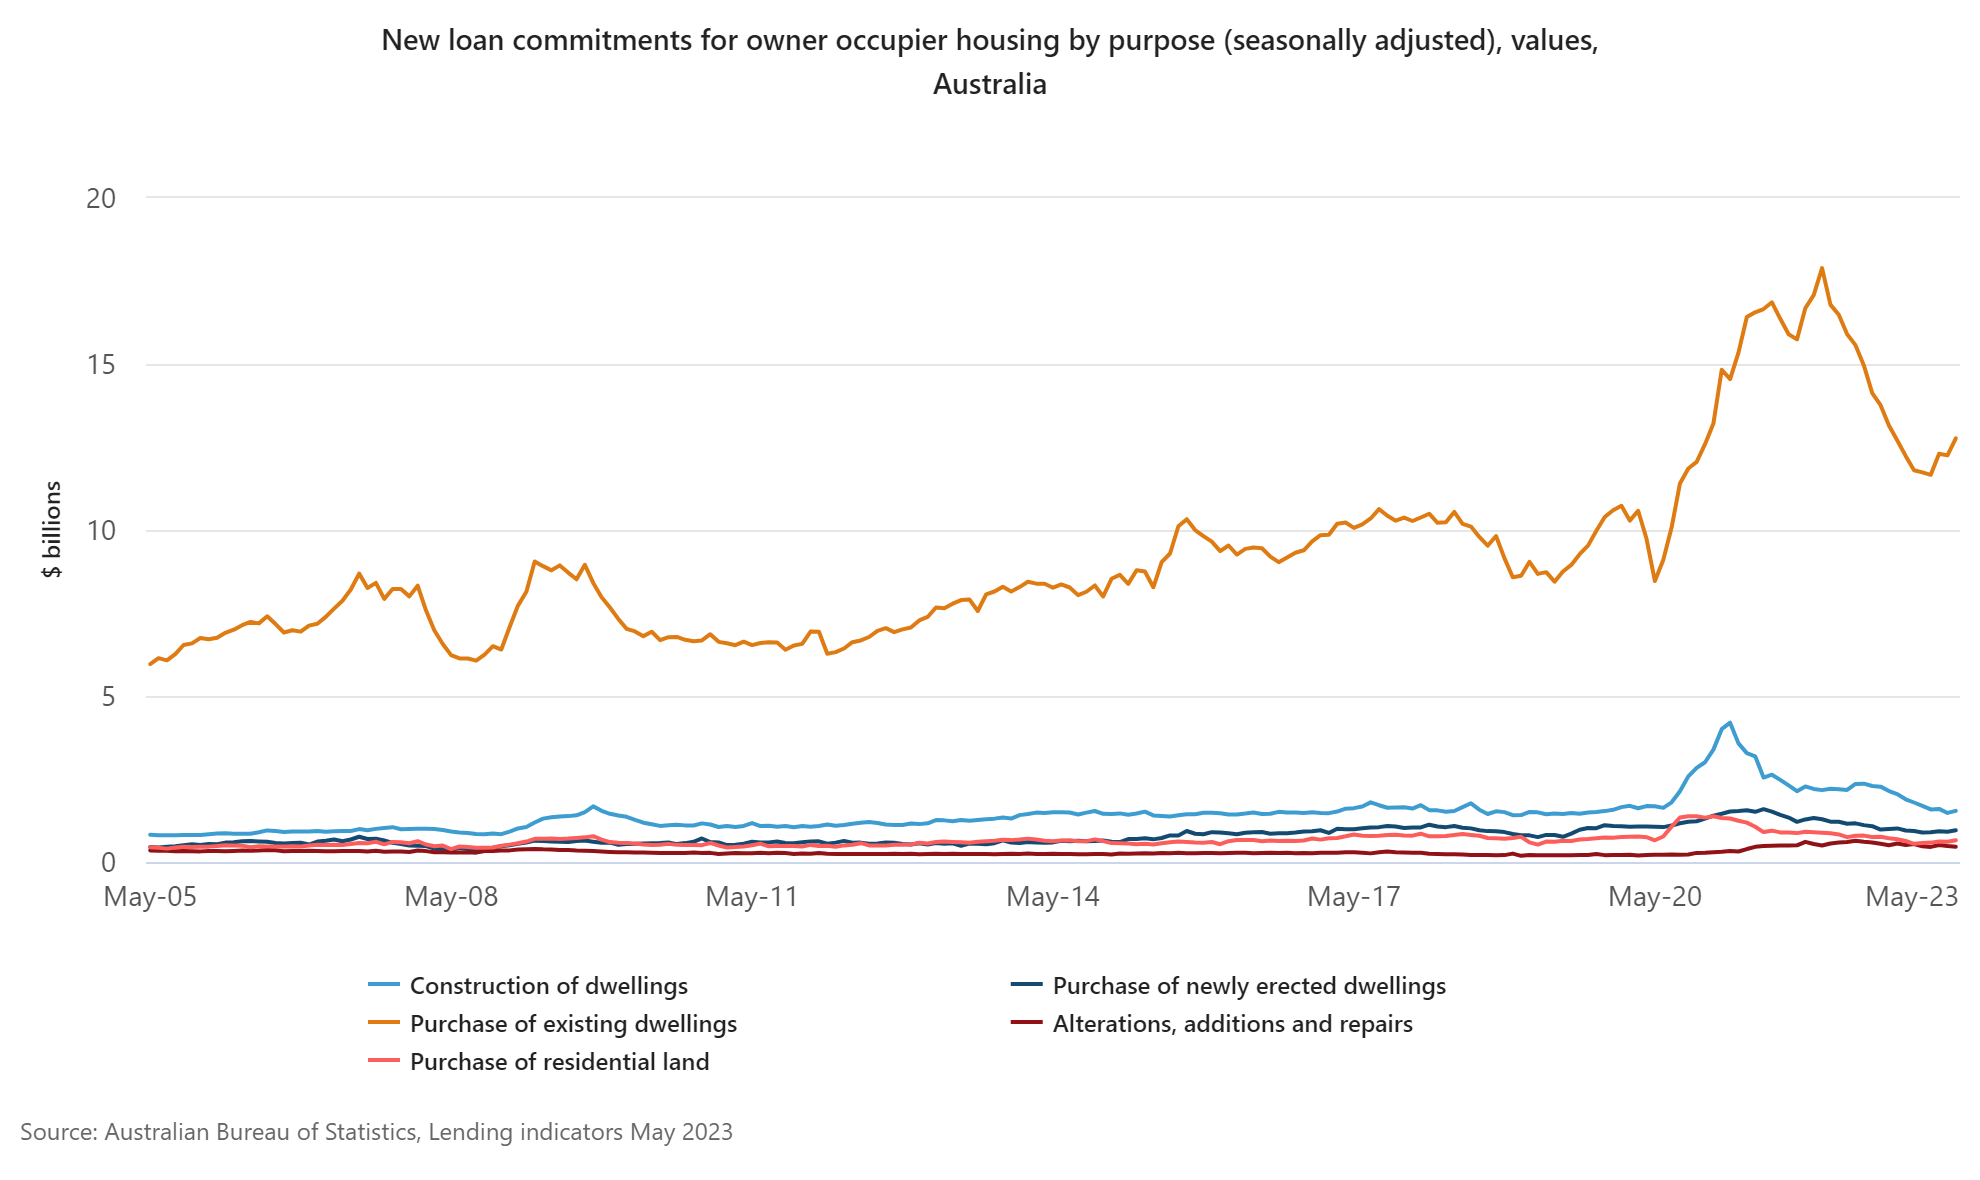
In May 2023, when considering seasonally adjusted data for owner-occupier housing, there were distinct trends in the value of new loan commitments:
1. New loan commitments for the purchase of existing dwellings increased by 4.2%, but were 18.0% lower compared to the same period last year.
2. Commitments for the construction of new dwellings saw a 4.1% rise, although they were 34.5% lower compared to a year ago.
3. New loan commitments for the purchase of new dwellings experienced a 4.7% increase, yet they were 17.9% lower compared to the previous year.
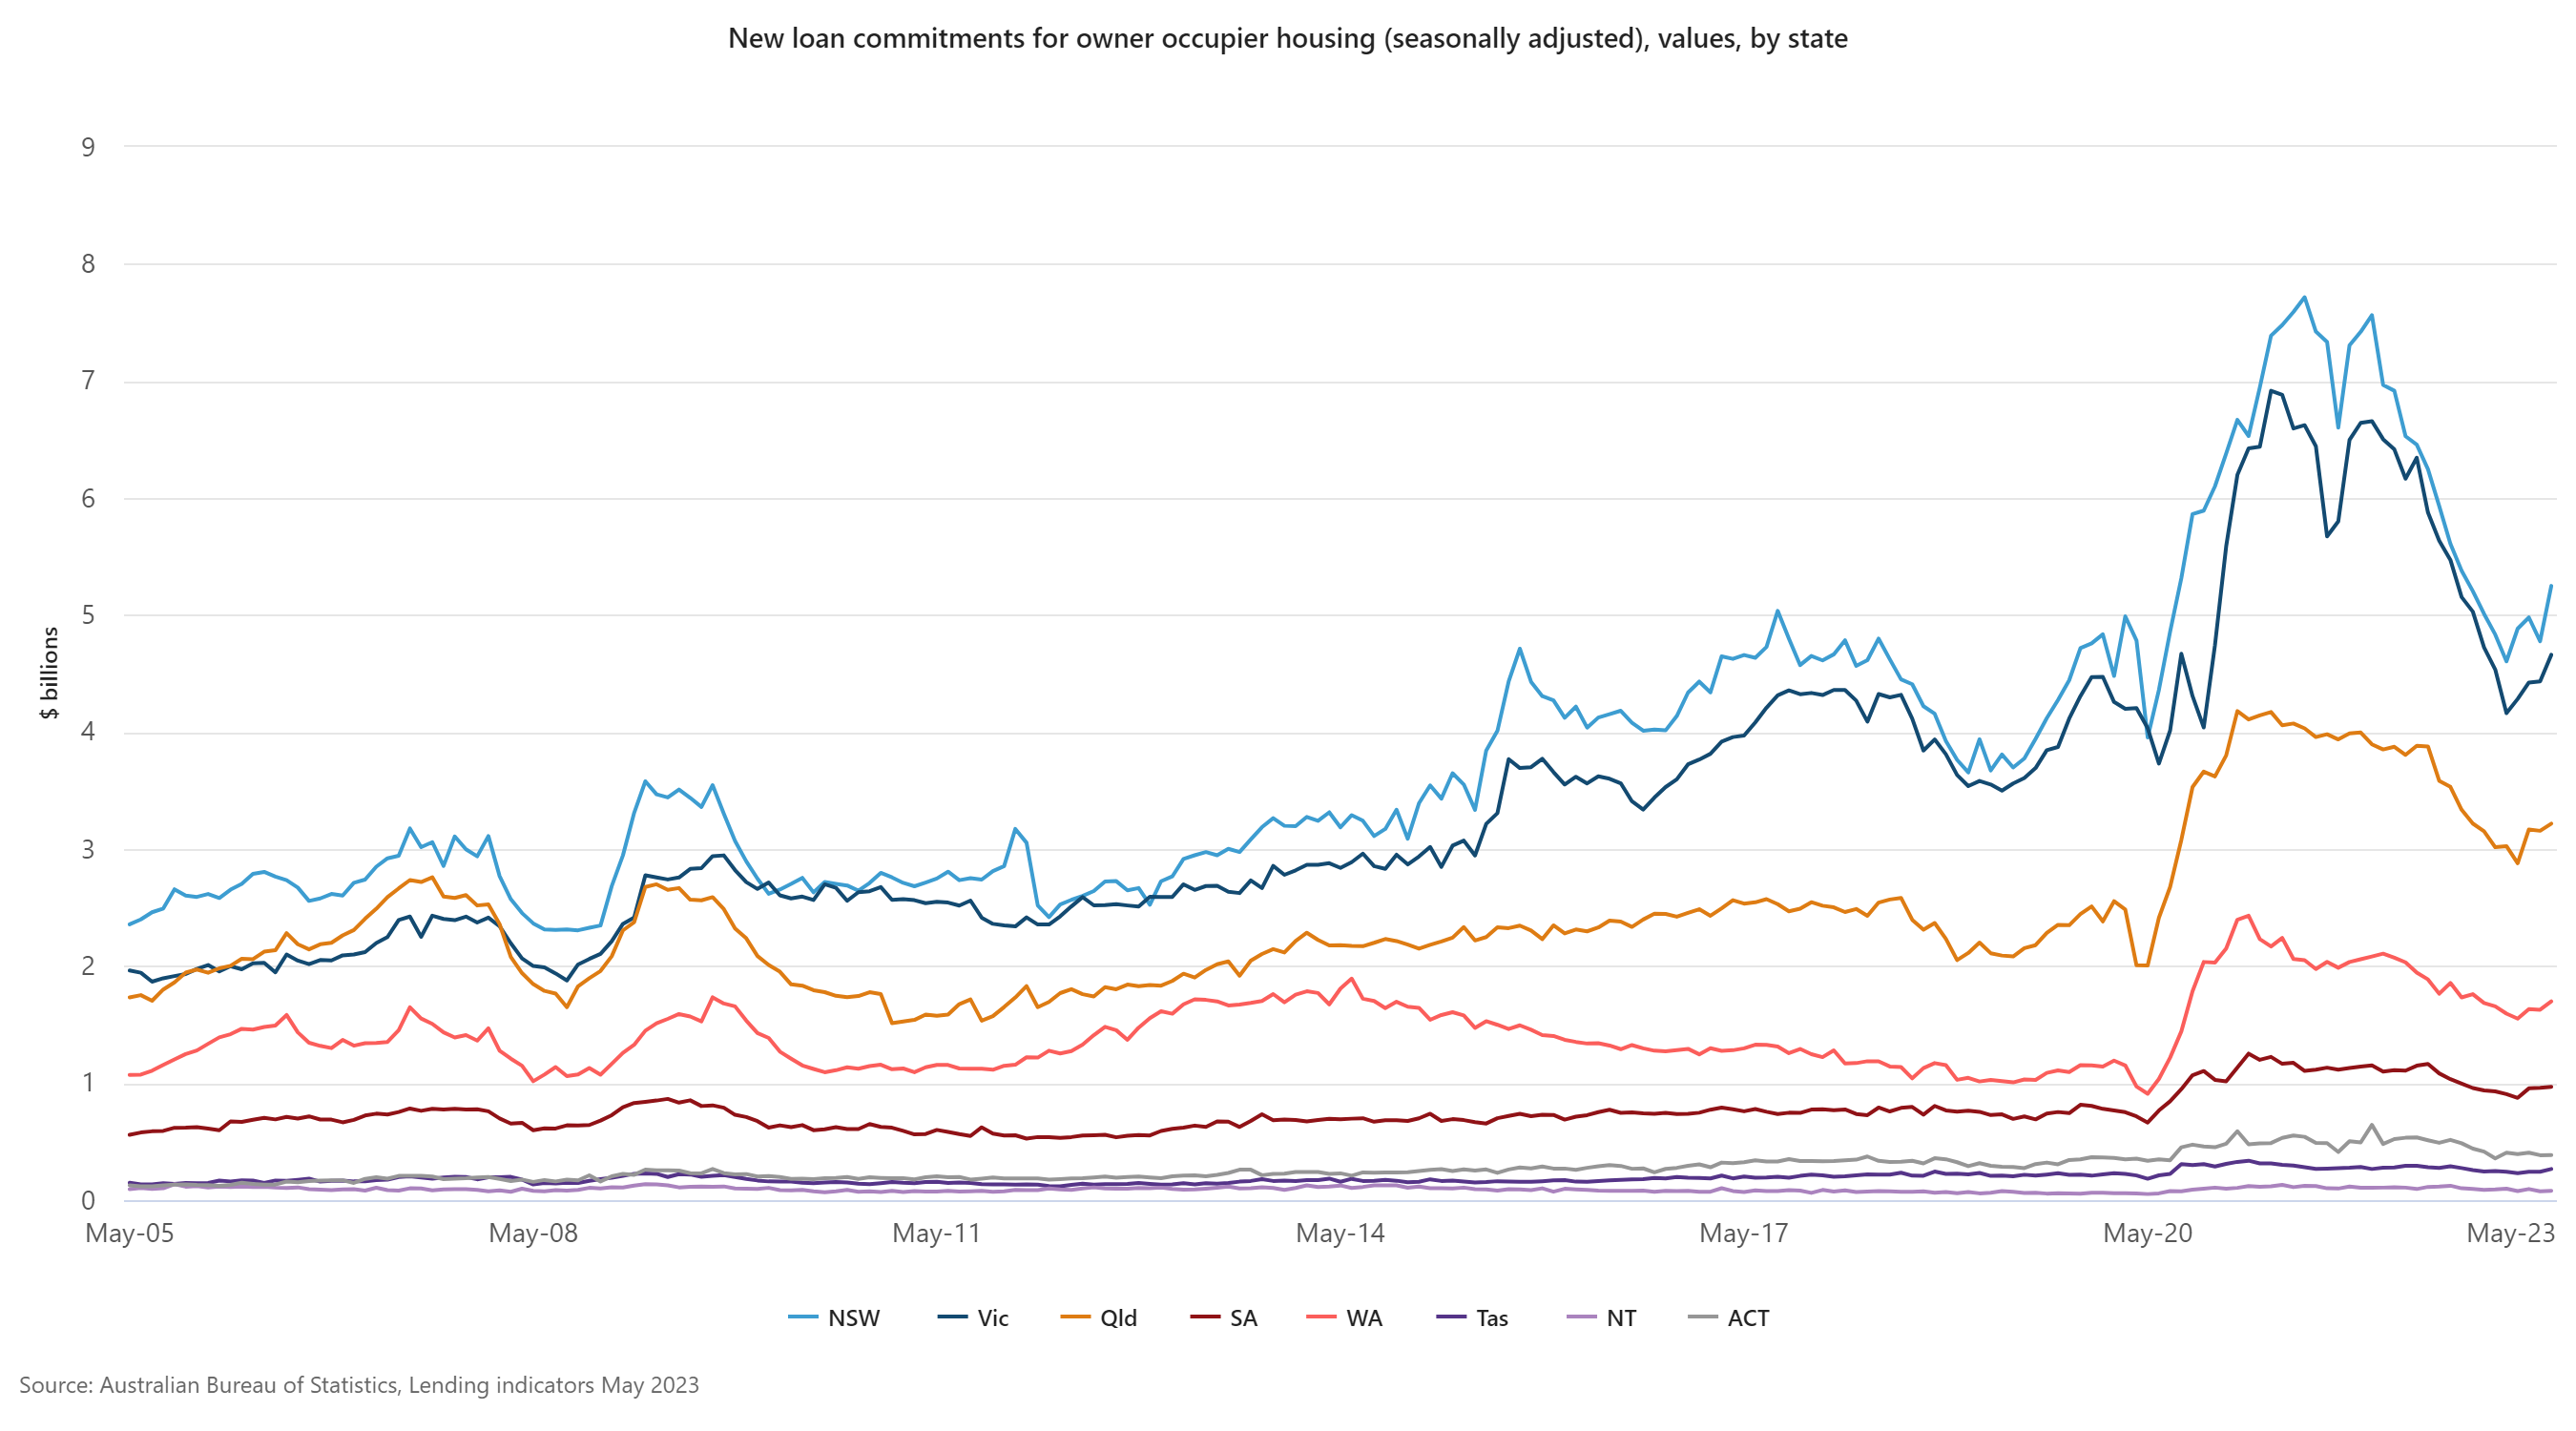
In May 2023, when considering seasonally adjusted data for owner-occupier housing, there were notable regional variations in the value of new loan commitments:
1. In New South Wales, there was a significant rise of 9.9%.
2. Victoria experienced a 5.1% increase.
3. Western Australia saw a 4.4% growth.
4. Queensland recorded a modest increase of 1.9%.
5. Tasmania displayed a substantial surge of 9.6%.
6. South Australia saw a slight uptick of 0.8%.
7. The Northern Territory experienced a notable 7.2% rise.
8. The Australian Capital Territory recorded a marginal increase of 0.3%.
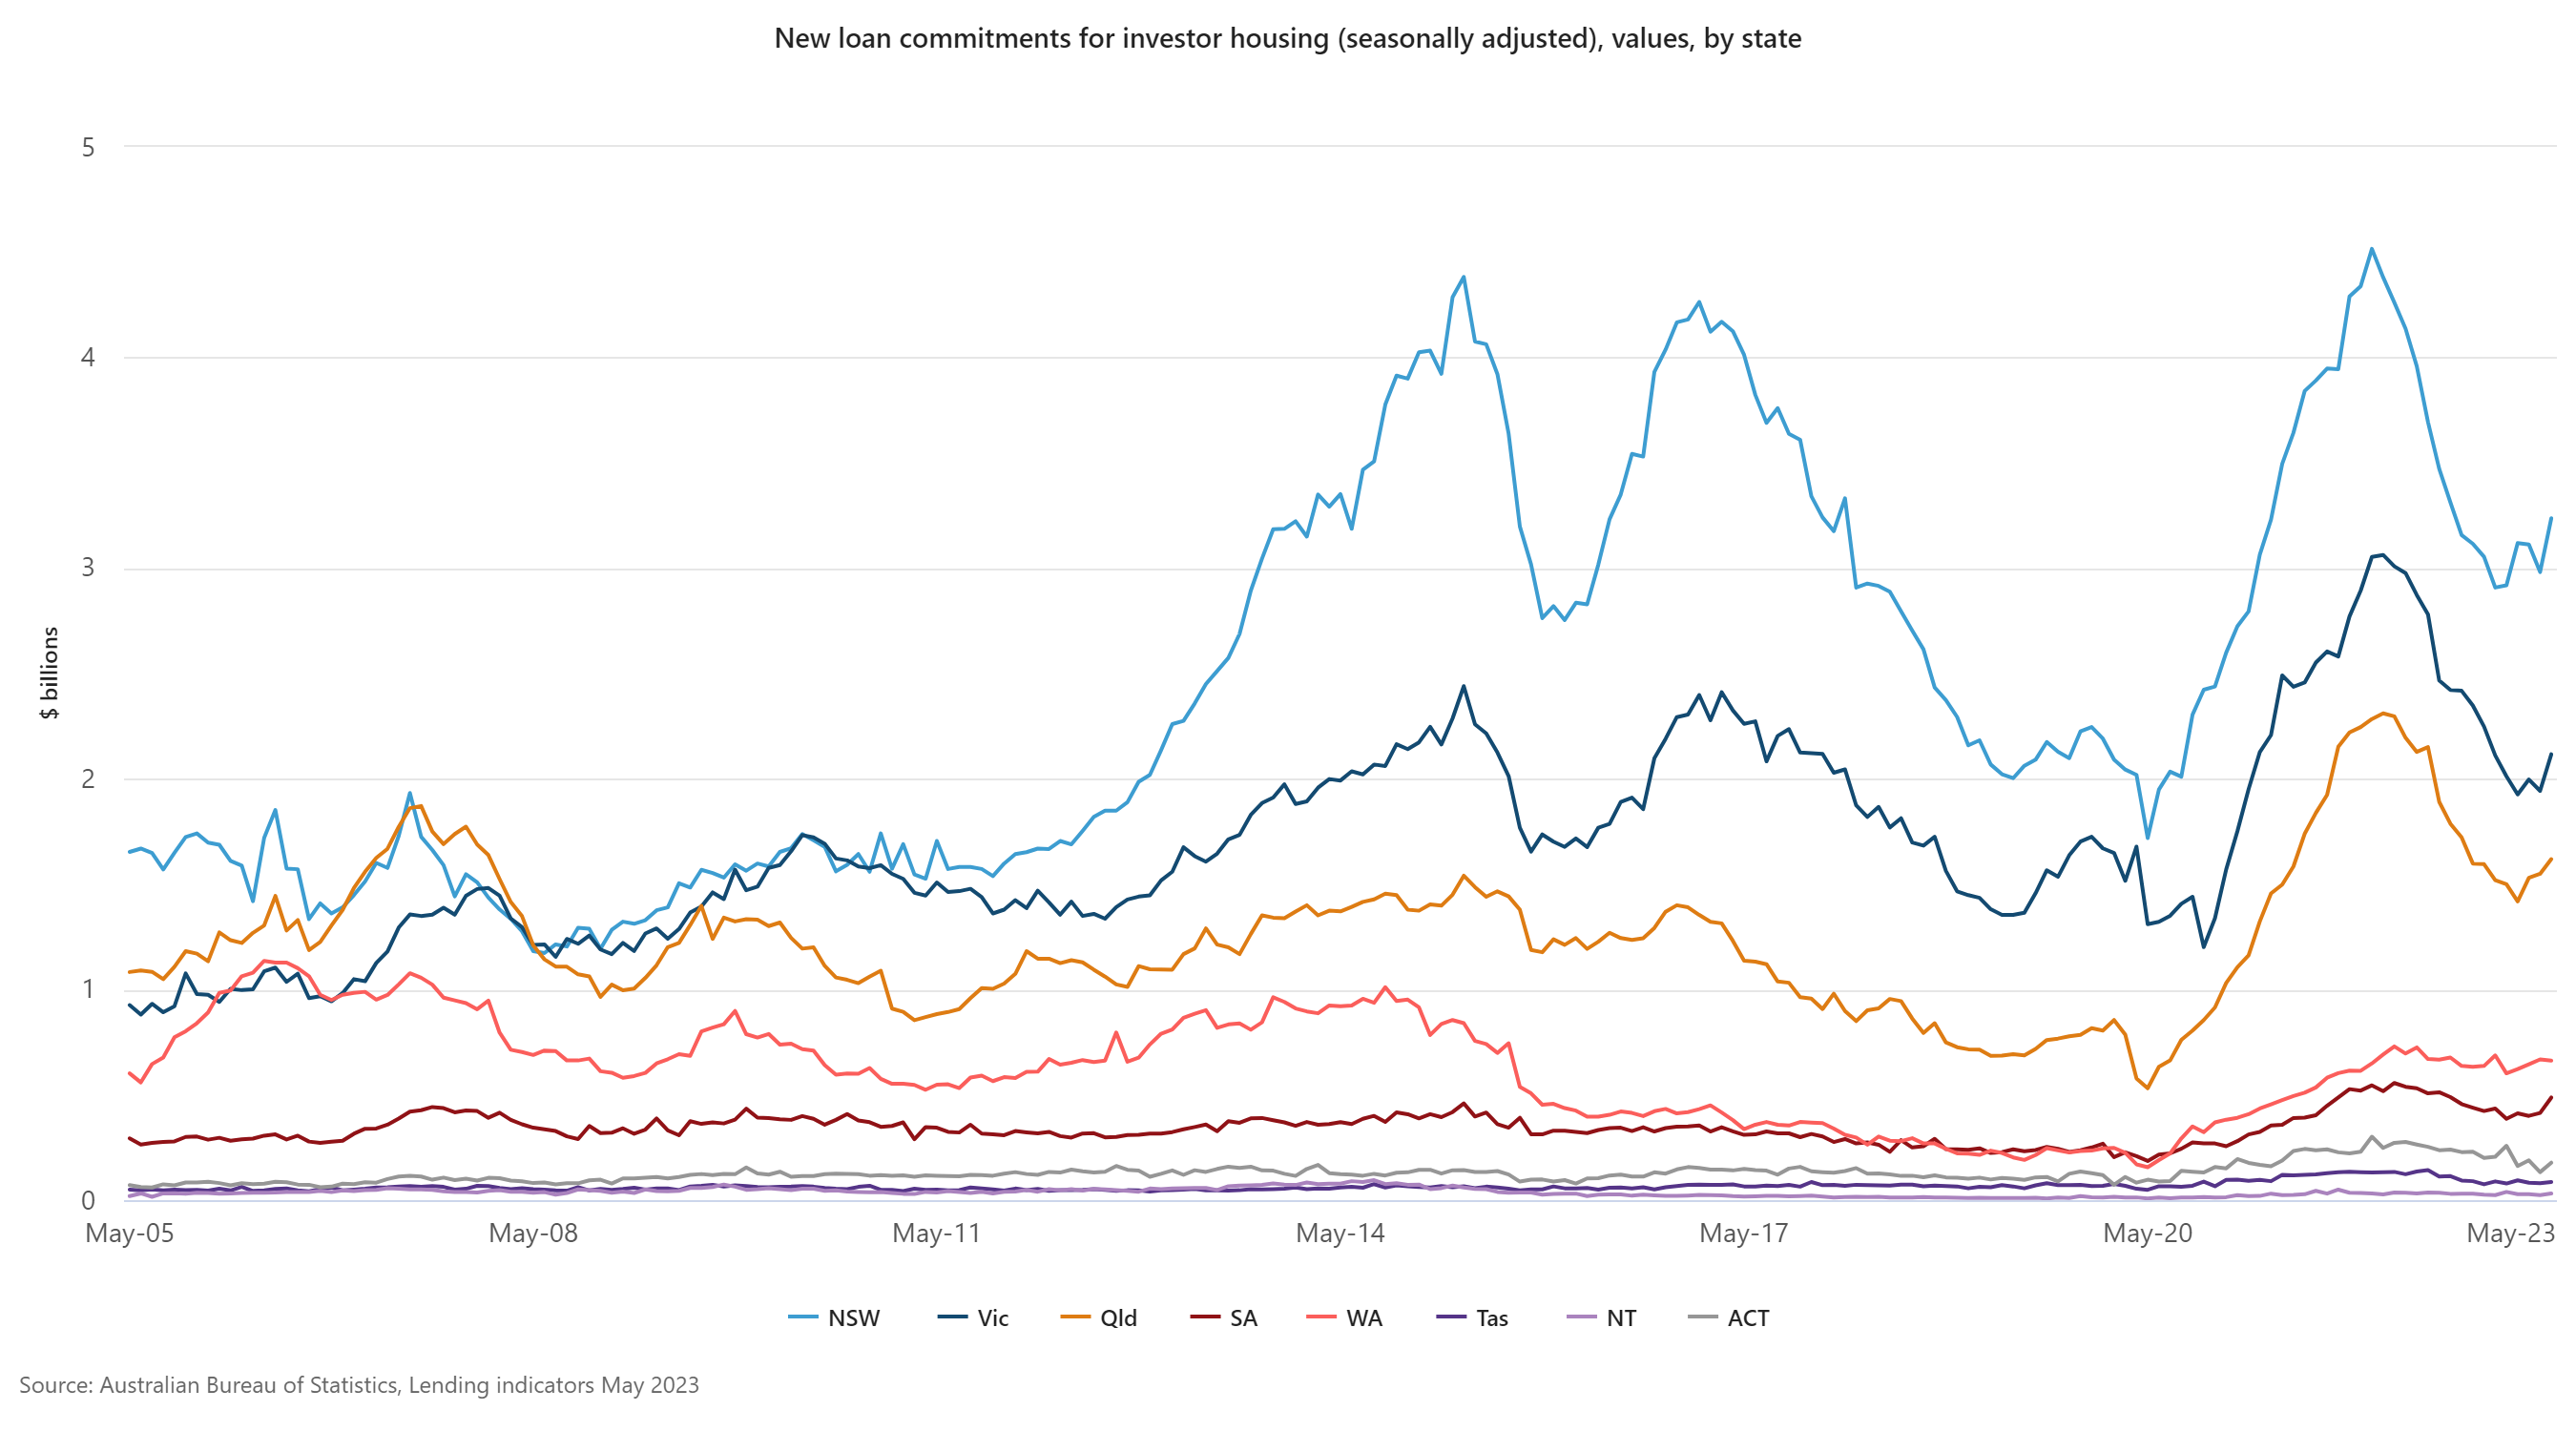
In May 2023, when considering seasonally adjusted data for investor housing, there were distinctive regional trends in the value of new loan commitments:
1. New South Wales experienced an 8.5% increase.
2. Victoria saw a notable rise of 9.0%.
3. South Australia displayed a significant surge of 17.5%.
4. Queensland recorded a growth of 4.5%.
5. The Australian Capital Territory (ACT) and the Northern Territory (NT) exhibited substantial increases, with the ACT rising by 33.3% and the NT by 33.2%. It’s worth noting that the series for ACT and NT, while smaller, are typically more volatile.
6. Tasmania also saw an increase, with a rise of 7.2%.
7. However, Western Australia saw a decrease of 0.9%.
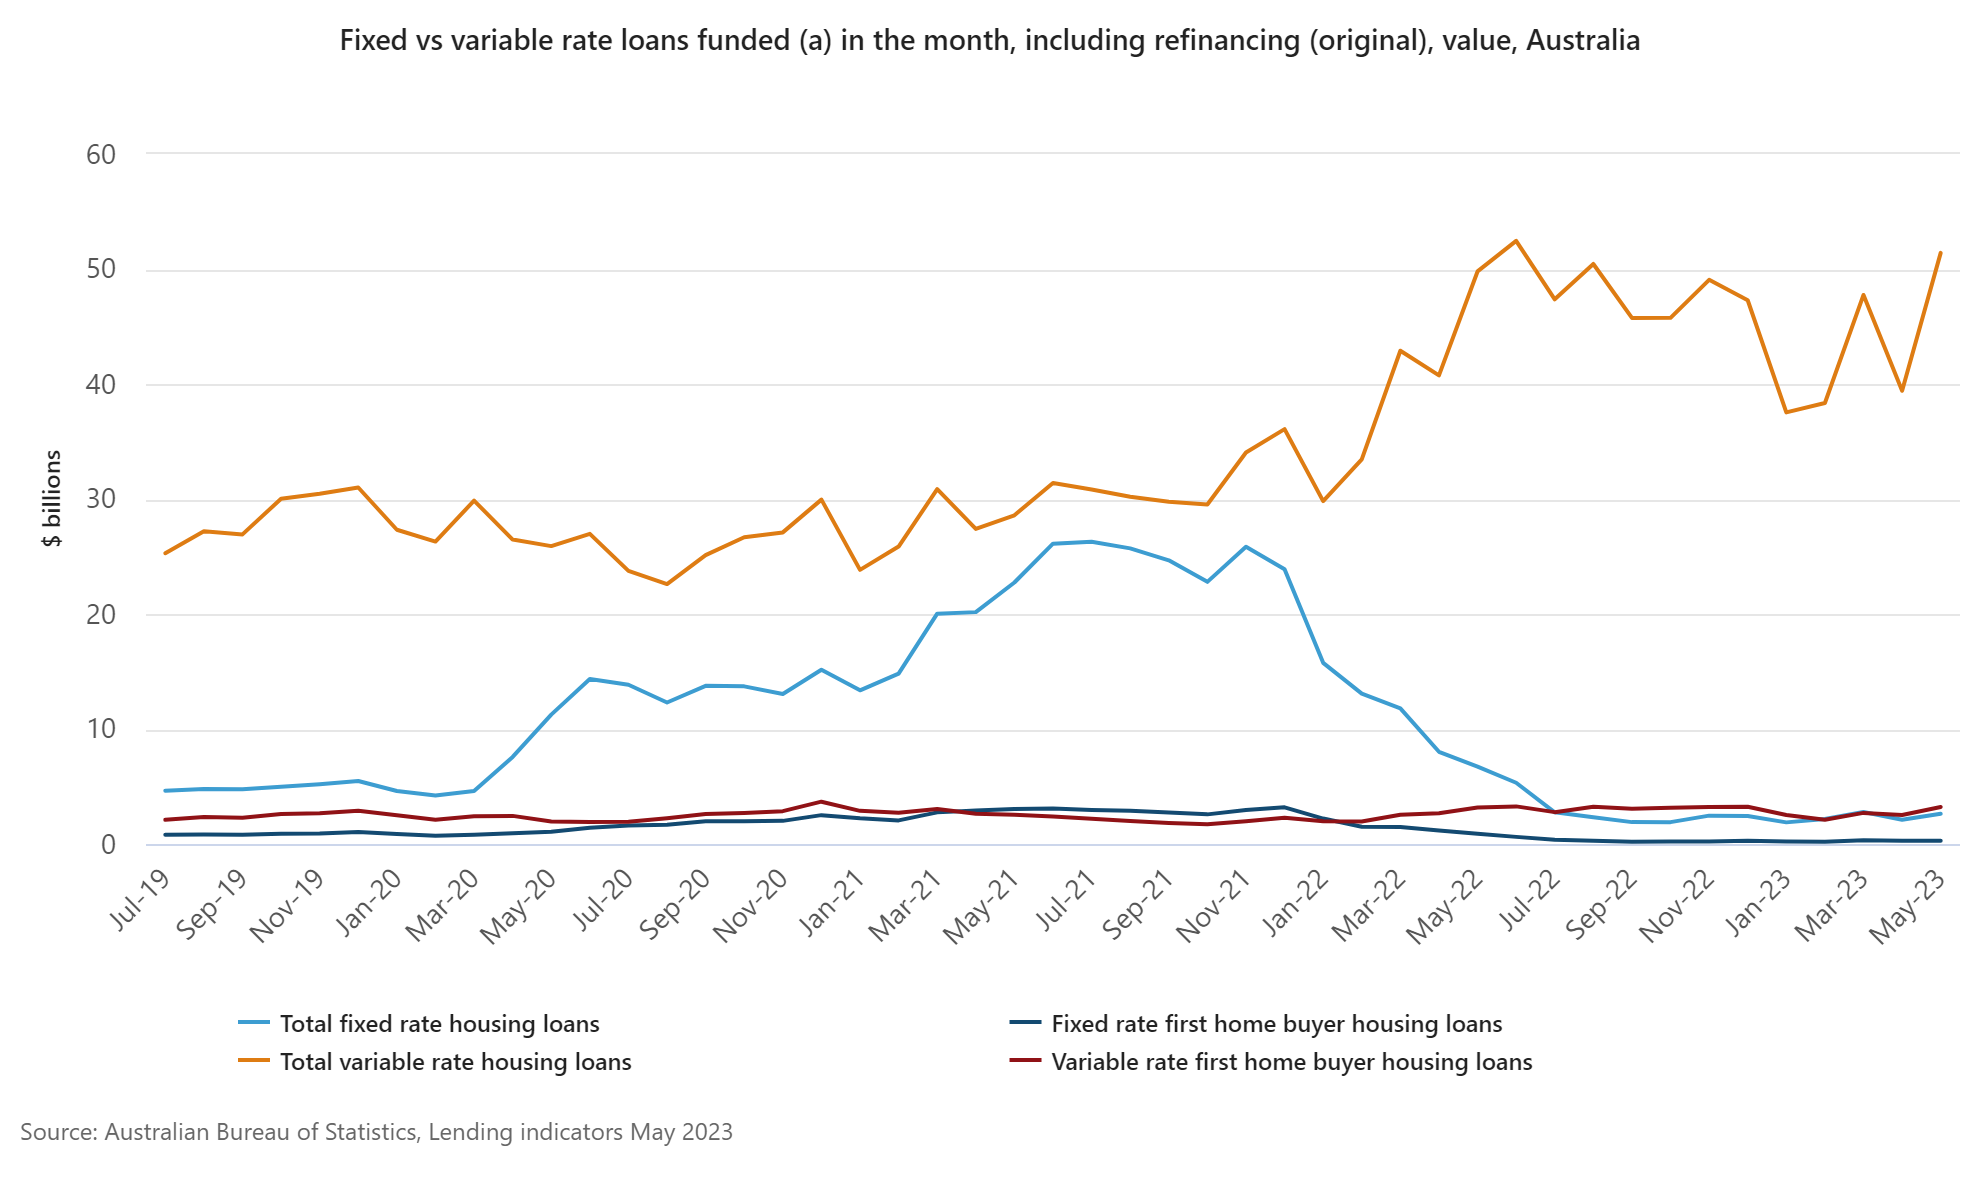
In May 2023, in original terms, there were distinct changes in the value of new loan commitments:
1. New variable rate loan commitments funded in the month saw a substantial increase of 30.4%.
2. New variable rate loan commitments specifically for first home buyers also experienced a significant rise, up by 27.3%.
3. The value of new fixed rate loan commitments funded in the month rose by 24.9%.
4. However, new fixed rate loan commitments targeted at first home buyers saw a decrease of 3.9%.
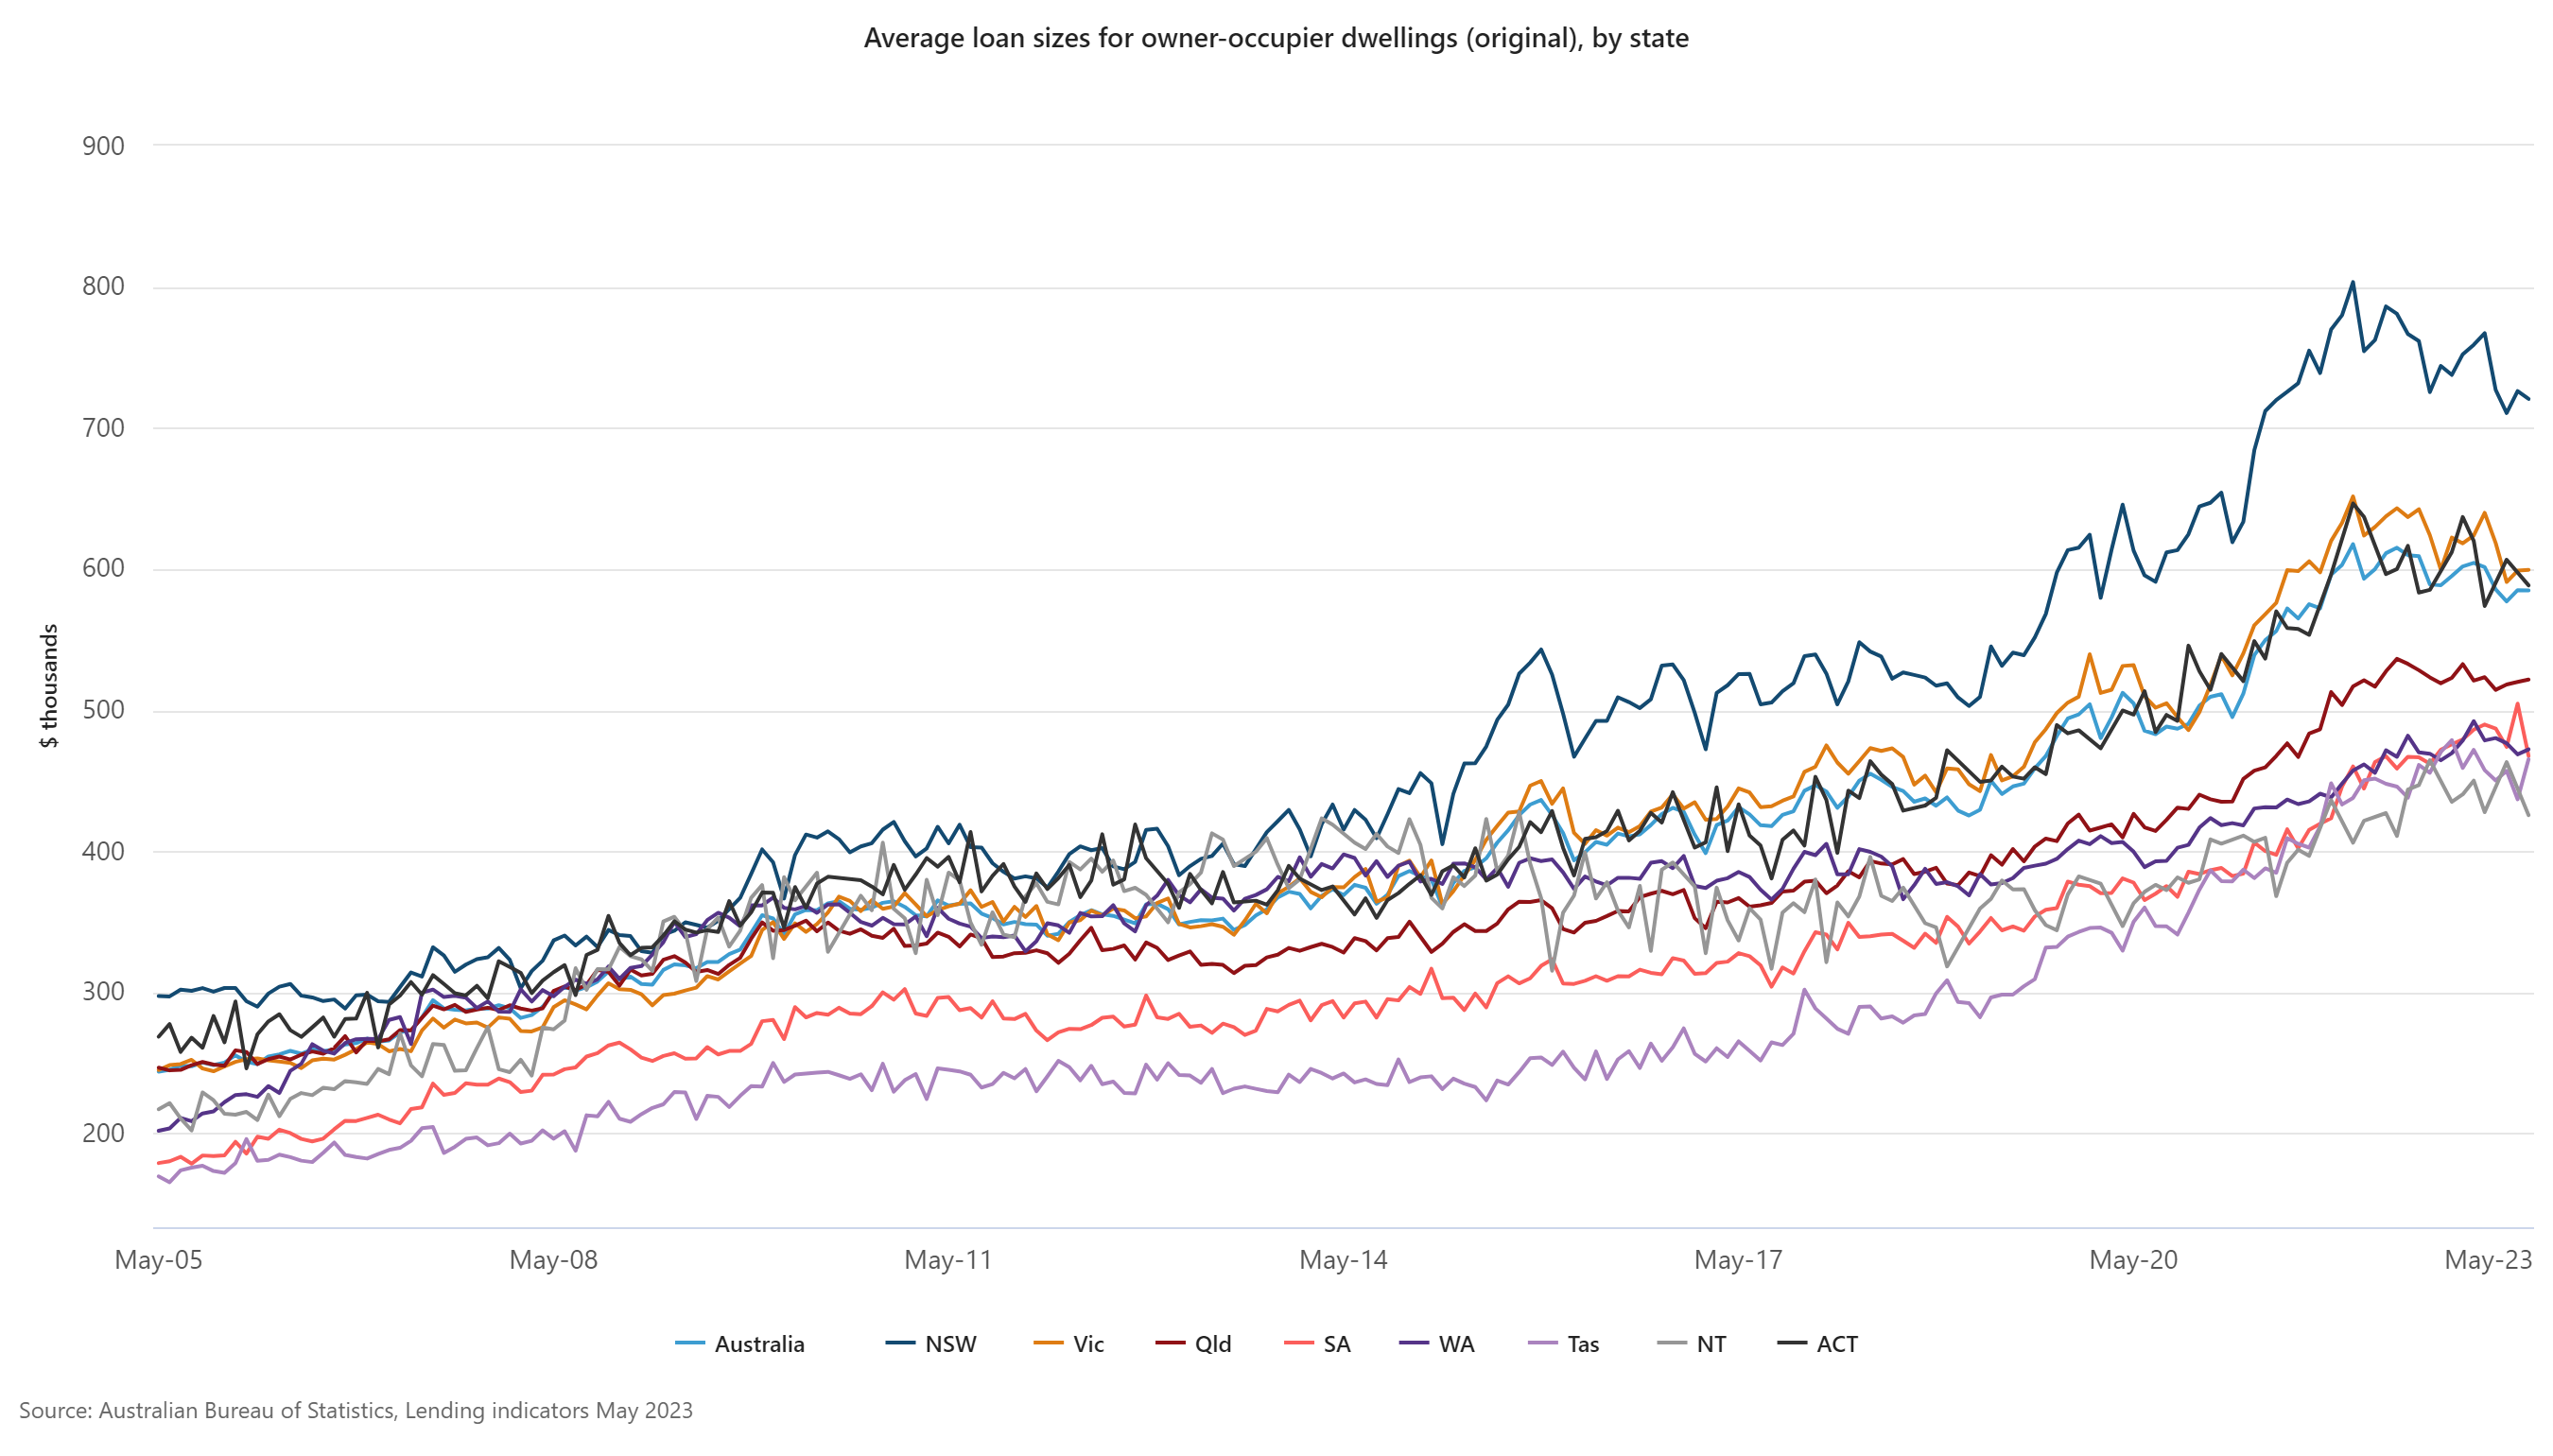
In May 2023, considering original data, the average loan sizes for owner-occupier dwellings, which encompass construction, purchase of new dwellings, and existing dwellings:
1. Registered a marginal decrease of 0.02%, with the national average loan size at $585,000.
2. However, this figure remained significantly higher, marking a 21.8% increase when compared to the pre-pandemic average observed in February 2020.
First home buyers
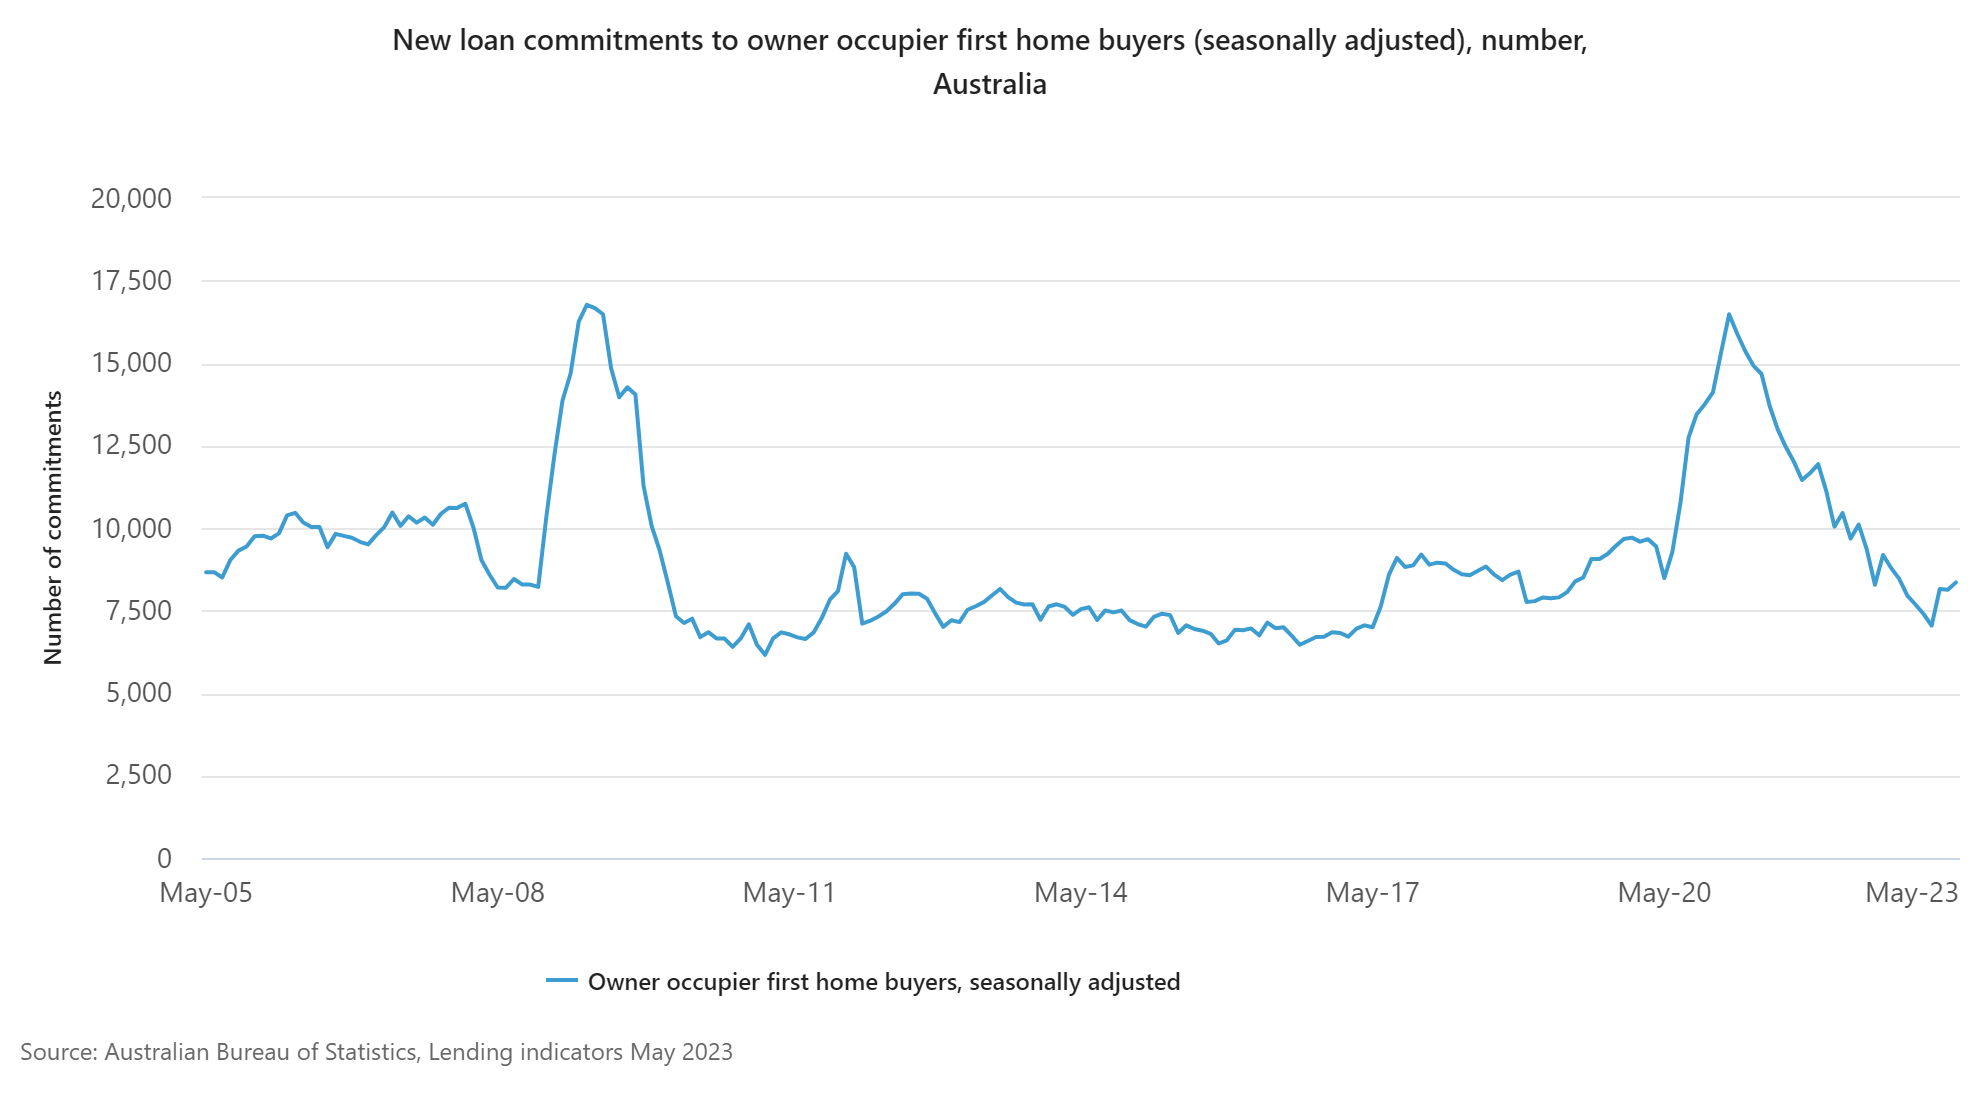
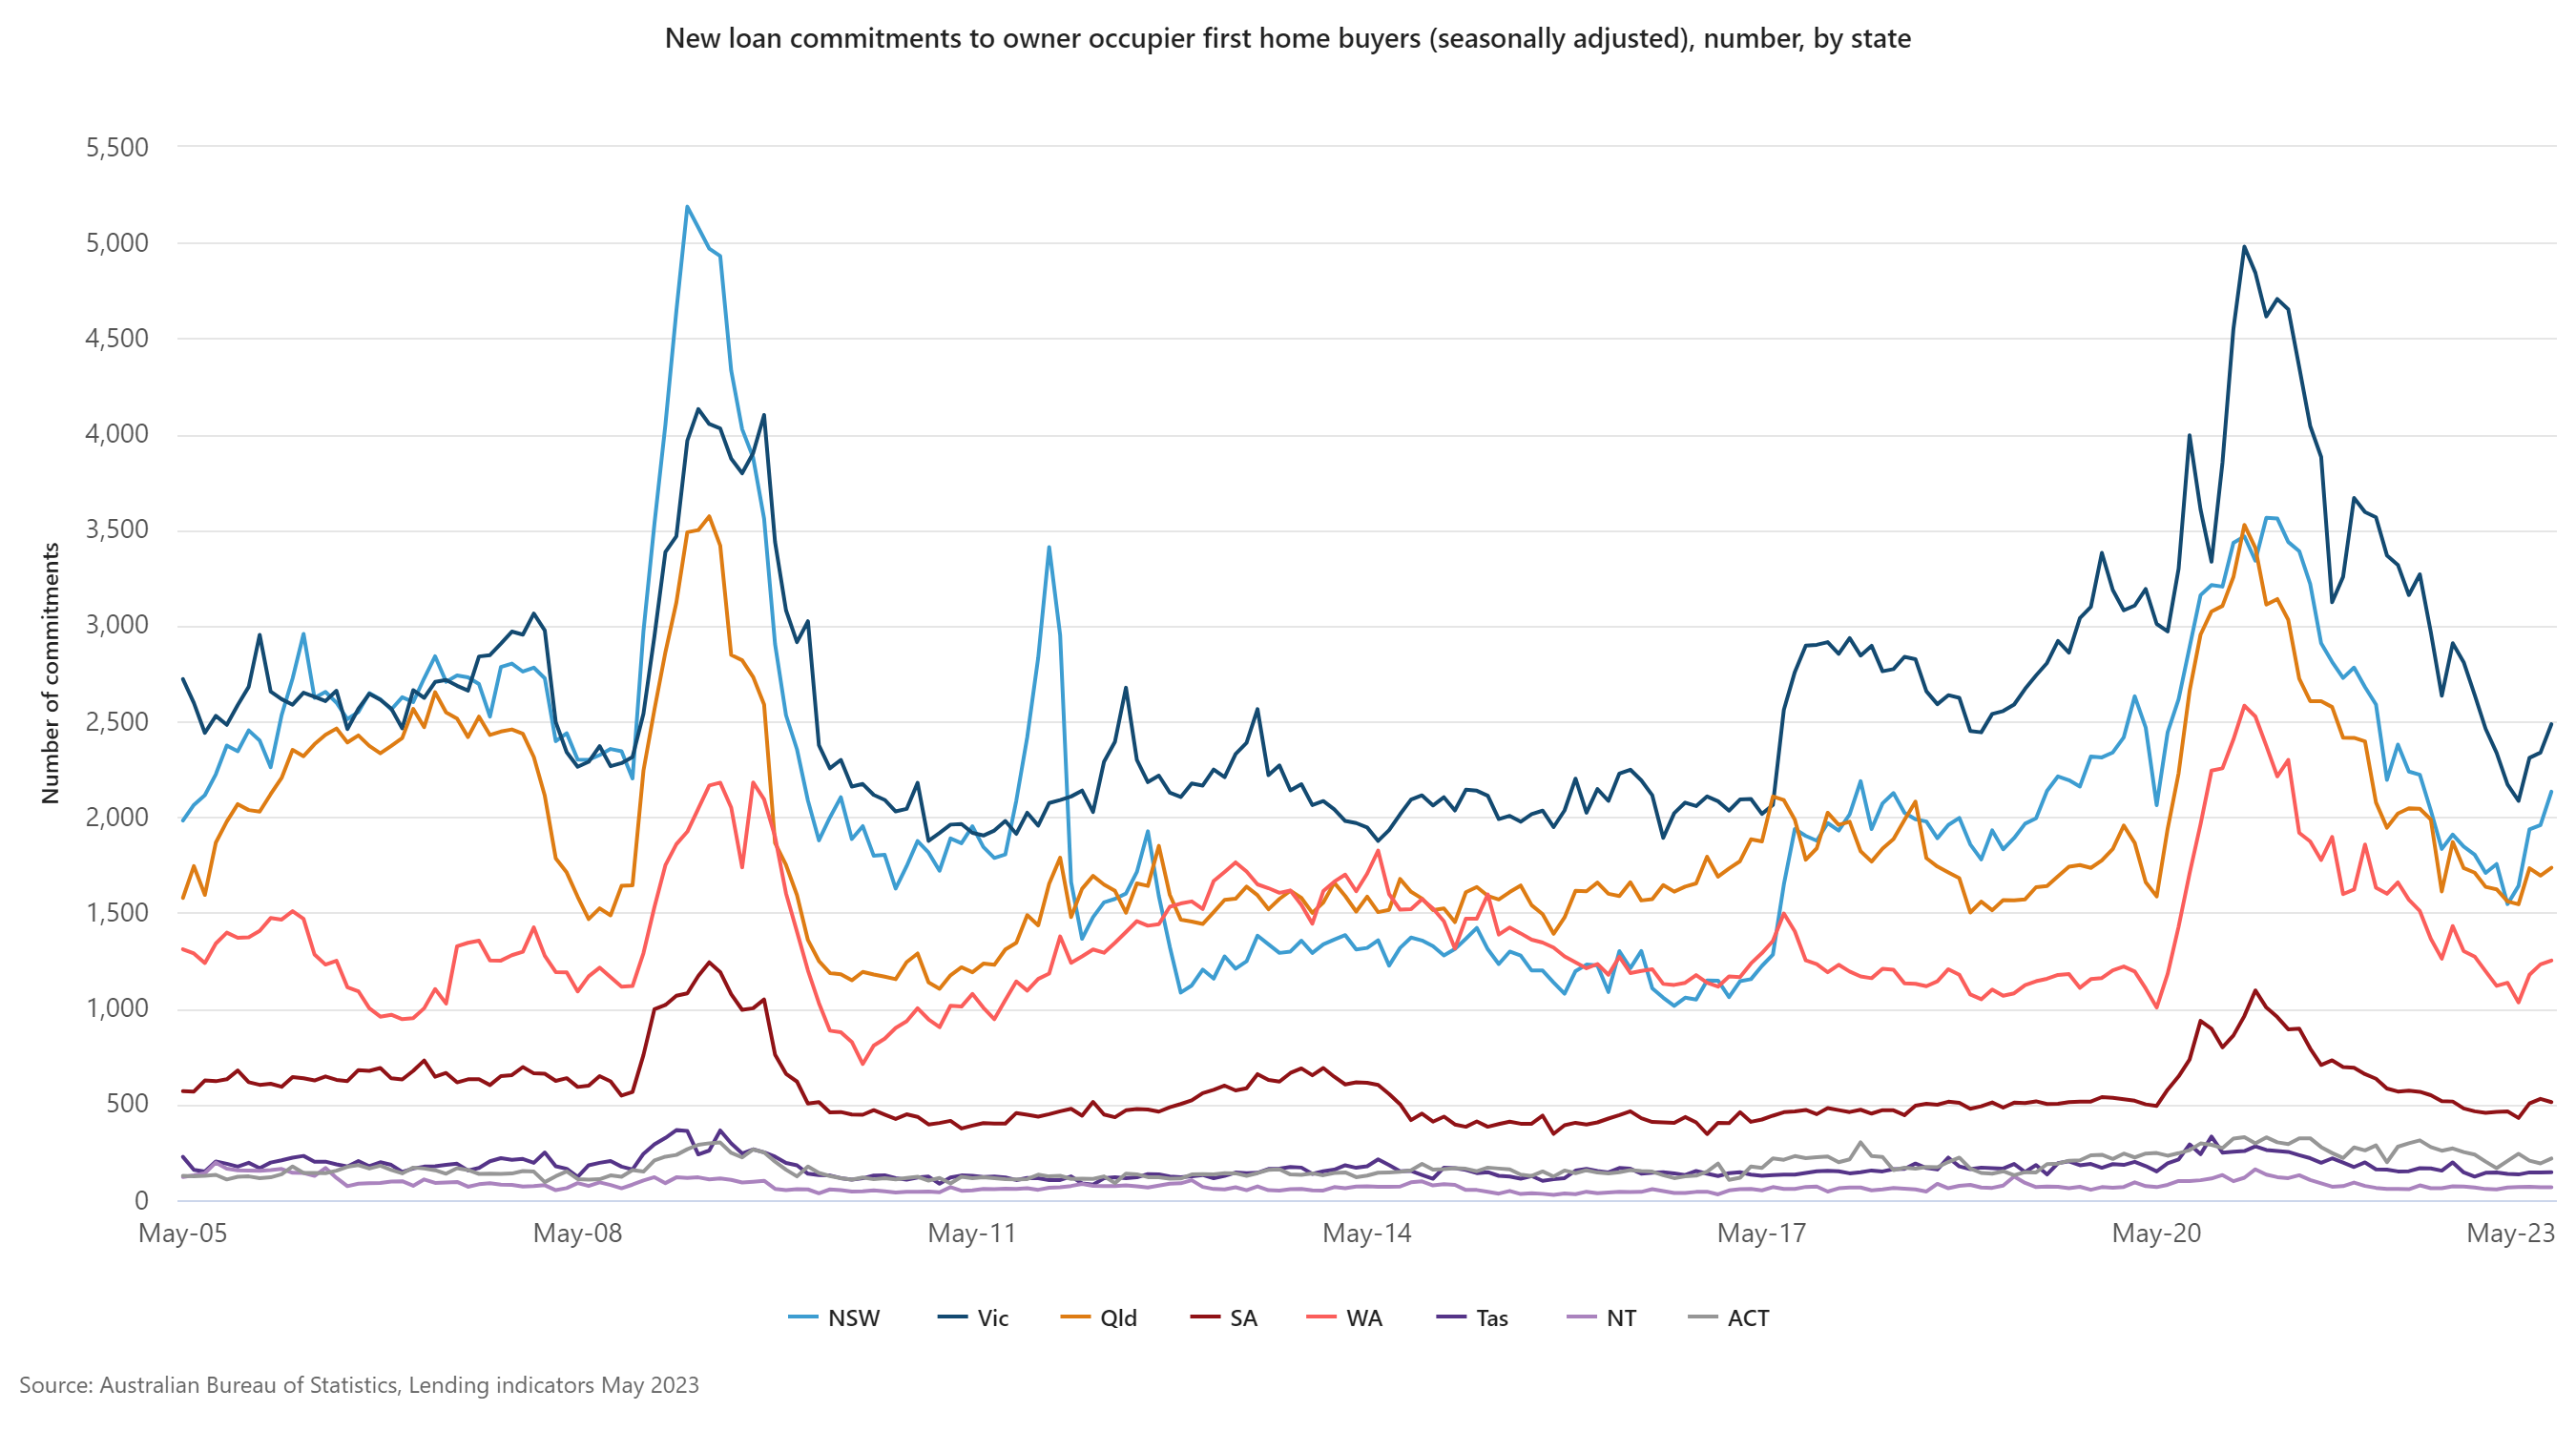
In May 2023, when considering seasonally adjusted terms for owner-occupier first home buyers, there were notable variations in the number of new loan commitments:
1. Nationally, there was a 2.7% increase, reaching 8,352 commitments, following a 0.3% dip in April. However, this figure stood at 17.4% lower compared to the previous year.
2. In New South Wales, there was a substantial rise of 8.9%.
3. Victoria saw a notable increase of 6.4%.
4. Queensland experienced a 2.4% growth.
5. The Australian Capital Territory (ACT) demonstrated a significant surge of 13.0%.
6. Western Australia recorded a modest uptick of 1.6%.
7. Tasmania also saw an increase of 0.7%.
8. Meanwhile, the Northern Territory maintained the same level as the previous month, showing no change.
9. On the other hand, South Australia witnessed a decrease of 3.2%.